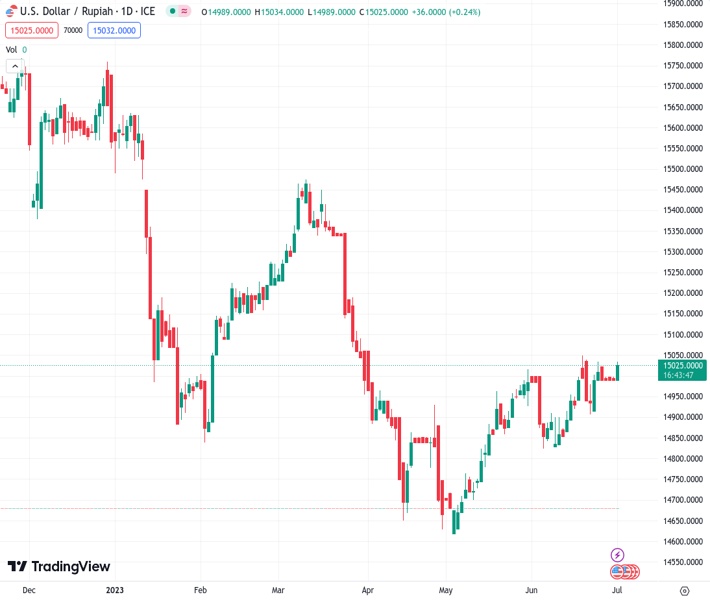
The current exchange rate of USDIDR at 15,025.0 is seeking to remain steady above 15,000 as there is a decrease in inflation in Indonesia.
…
This is a premium post.
[s2If !current_user_can(access_s2member_level4)]Please register for FREE REGISTER to read full post below containing analysis. In case of any error or you think you are not able to read the full post below, please email us at support#nehcap.com [lwa][/s2If] [s2If current_user_can(access_s2member_level1)]
- USD/IDR is looking for stability above 15,000 amid a decline in Indonesian inflation.
The pair currently trades last at 15025.0.
The previous day high was 15087.35 while the previous day low was 14992.5. The daily 38.2% Fib levels comes at 15028.7327, expected to provide resistance. Similarly, the daily 61.8% fib level is at 15051.1173, expected to provide resistance.
The USD/IDR pair is aiming for stability above the crucial resistance of 15,000 in the Asian session. The asset has picked some strength as Statistics Indonesia has reported that the Consumer Price Index (CPI) softened in June.
Monthly inflation showed a mild pace of 0.14% while the street was estimating a higher pace of 0.24% but remained higher than the pace of 0.09% being recorded last month. Annual inflation decelerated to 3.52% vs. the consensus of 3.64% and the former release of 4%. Core inflation that excludes oil and food prices landed at 2.58% but remained lower than the expectations of 2.64% and the prior release of 2.66%. This might allow the Bank Indonesia (BI) to keep the interest rates steady further.
Meanwhile, S&P500 futures are flat portraying a quite market mood. US equities were heavily bought last week as the street is anticipating that the Federal Reserve (Fed) might go with only one interest rate hike. The US Dollar Index (DXY) has faced barricades around 103.00 and is expected to remain volatile ahead of the United States Manufacturing PMI data to be released by the Institute of Supply Management (ISM) department.
As per the consensus, Manufacturing PMI is seen expanding to 47.2 vs. the former release of 46.9. Investors should note that US Manufacturing PMI has been contracting straight for the past seven months and is expected to continue its contracting spell due to higher interest rates from the Fed. Apart from that, New Orders Index is expected to jump to 44.0 vs. the former release of 42.6.
Technical Levels: Supports and Resistances
USDIDR currently trading at 15032.65 at the time of writing. Pair opened at 15040.4 and is trading with a change of -0.05 % .
| Overview | Overview.1 | |
|---|---|---|
| 0 | Today last price | 15032.65 |
| 1 | Today Daily Change | -7.75 |
| 2 | Today Daily Change % | -0.05 |
| 3 | Today daily open | 15040.40 |
The pair is trading above its 20 Daily moving average @ 14946.9875, above its 50 Daily moving average @ 14881.956 , above its 100 Daily moving average @ 15014.9455 and below its 200 Daily moving average @ 15224.56
| Trends | Trends.1 | |
|---|---|---|
| 0 | Daily SMA20 | 14946.9875 |
| 1 | Daily SMA50 | 14881.9560 |
| 2 | Daily SMA100 | 15014.9455 |
| 3 | Daily SMA200 | 15224.5600 |
The previous day high was 15087.35 while the previous day low was 14992.5. The daily 38.2% Fib levels comes at 15028.7327, expected to provide resistance. Similarly, the daily 61.8% fib level is at 15051.1173, expected to provide resistance.
Note the levels of interest below:
- Pivot support is noted at 14992.8167, 14945.2333, 14897.9667
- Pivot resistance is noted at 15087.6667, 15134.9333, 15182.5167
| Levels | Levels.1 |
|---|---|
| Previous Daily High | 15087.3500 |
| Previous Daily Low | 14992.5000 |
| Previous Weekly High | 15087.3500 |
| Previous Weekly Low | 14875.6000 |
| Previous Monthly High | 15087.3500 |
| Previous Monthly Low | 14140.0500 |
| Daily Fibonacci 38.2% | 15028.7327 |
| Daily Fibonacci 61.8% | 15051.1173 |
| Daily Pivot Point S1 | 14992.8167 |
| Daily Pivot Point S2 | 14945.2333 |
| Daily Pivot Point S3 | 14897.9667 |
| Daily Pivot Point R1 | 15087.6667 |
| Daily Pivot Point R2 | 15134.9333 |
| Daily Pivot Point R3 | 15182.5167 |
[/s2If]
Nehcap Expert Advisor
The NEHCAP MT4 EA is high quality professional trading system geared to generate returns without using GRID or martingales. Each trade has strict risk per trade parameter. The pairs under management include EURUSD, GBPUSD, AUDCAD, AUDNZD,GBPAUD, EURAUD, EURCAD, CHFJPY and many more.
The system is trading live: LIVE ACCOUNT TRACKING
You can run it free. Apply for a free trial and track our account. Buy the system or use profit share mechanism to generate returns on your MT4.
Join Our Telegram Group
")


