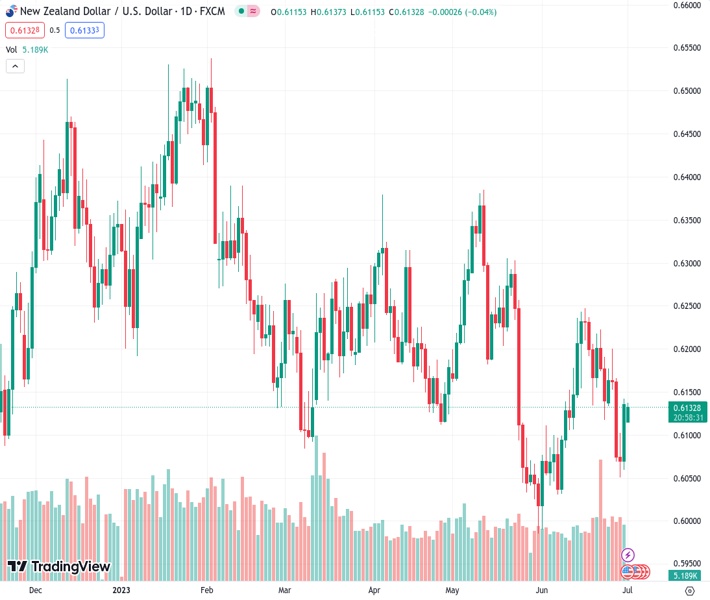
The NZDUSD pair failed to maintain its upward momentum at the price level of 0.61240, which resulted in an unsuccessful attempt to fill the gap from the beginning of the week. The perspective of Nehcap suggests that there is not much potential for significant downside movement.
…
This is a premium post.
[s2If !current_user_can(access_s2member_level4)]Please register for FREE REGISTER to read full post below containing analysis. In case of any error or you think you are not able to read the full post below, please email us at support#nehcap.com [lwa][/s2If] [s2If current_user_can(access_s2member_level1)]
- NZD/USD fails to defend the week-start gap towards the north.
The pair currently trades last at 0.61240.
The previous day high was 0.6143 while the previous day low was 0.6059. The daily 38.2% Fib levels comes at 0.6111, expected to provide support. Similarly, the daily 61.8% fib level is at 0.6091, expected to provide support.
NZD/USD retreats from intraday high to around 0.6135 as the pair traders await the top-tier PMIs from China and the US amid the early hours of Monday’s Asian session. In doing so, the Kiwi pair consolidates intraday gains after posting an upside gap to begin the trading week, not to forget the two consecutive weekly and quarterly falls in the last.
The Kiwi pair’s latest pullback could be linked to the inability to cross the 200-Hour Moving Average (HMA), as well as the RSI (14) line’s retreat from the overbought territory. The same join the impending bear cross on the MACD indicator to lure the intraday sellers.
With this, the NZD/USD bears may aim for the 0.6100 round figure during the pair’s further declines. However, a convergence of the 50-HMA and the bottom line of a two-day-old rising trend channel, around 0.6090 by the press time, appears a tough nut to crack for the sellers.
In a case where the quote drops below 0.6090, the odds of witnessing a slump toward the previous weekly low of 0.6050 and then to the monthly bottom surrounding 0.5990 can’t be ruled out.
On the flip side, the NZD/USD pair’s rise past the 200-HMA, near 0.6145 at the latest, isn’t an open invitation to the bulls as the top line of the stated bullish channel, close to 0.6150, can test the pair’s further advances.
Even if the quote rises past 0.6150, a downward-sloping resistance line from June 15, near 0.6180 will act as the final defense of the bears.
Trend: Limited downside expected
Technical Levels: Supports and Resistances
NZDUSD currently trading at 0.6133 at the time of writing. Pair opened at 0.6111 and is trading with a change of 0.36% % .
| Overview | Overview.1 | |
|---|---|---|
| 0 | Today last price | 0.6133 |
| 1 | Today Daily Change | 0.0022 |
| 2 | Today Daily Change % | 0.36% |
| 3 | Today daily open | 0.6111 |
The pair remains strongly bearish on the daily time frame. It trades below the 20 SMA @ 0.614, 50 SMA 0.6167, 100 SMA @ 0.6195 and 200 SMA @ 0.6162.
| Trends | Trends.1 | |
|---|---|---|
| 0 | Daily SMA20 | 0.6140 |
| 1 | Daily SMA50 | 0.6167 |
| 2 | Daily SMA100 | 0.6195 |
| 3 | Daily SMA200 | 0.6162 |
The previous day high was 0.6143 while the previous day low was 0.6059. The daily 38.2% Fib levels comes at 0.6111, expected to provide support. Similarly, the daily 61.8% fib level is at 0.6091, expected to provide support.
Note the levels of interest below:
- Pivot support is noted at 0.6066, 0.602, 0.5982
- Pivot resistance is noted at 0.615, 0.6188, 0.6234
| Levels | Levels.1 |
|---|---|
| Previous Daily High | 0.6143 |
| Previous Daily Low | 0.6059 |
| Previous Weekly High | 0.6202 |
| Previous Weekly Low | 0.6050 |
| Previous Monthly High | 0.6250 |
| Previous Monthly Low | 0.5990 |
| Daily Fibonacci 38.2% | 0.6111 |
| Daily Fibonacci 61.8% | 0.6091 |
| Daily Pivot Point S1 | 0.6066 |
| Daily Pivot Point S2 | 0.6020 |
| Daily Pivot Point S3 | 0.5982 |
| Daily Pivot Point R1 | 0.6150 |
| Daily Pivot Point R2 | 0.6188 |
| Daily Pivot Point R3 | 0.6234 |
[/s2If]
Nehcap Expert Advisor
The NEHCAP MT4 EA is high quality professional trading system geared to generate returns without using GRID or martingales. Each trade has strict risk per trade parameter. The pairs under management include EURUSD, GBPUSD, AUDCAD, AUDNZD,GBPAUD, EURAUD, EURCAD, CHFJPY and many more.
The system is trading live: LIVE ACCOUNT TRACKING
You can run it free. Apply for a free trial and track our account. Buy the system or use profit share mechanism to generate returns on your MT4.
Join Our Telegram Group
")


