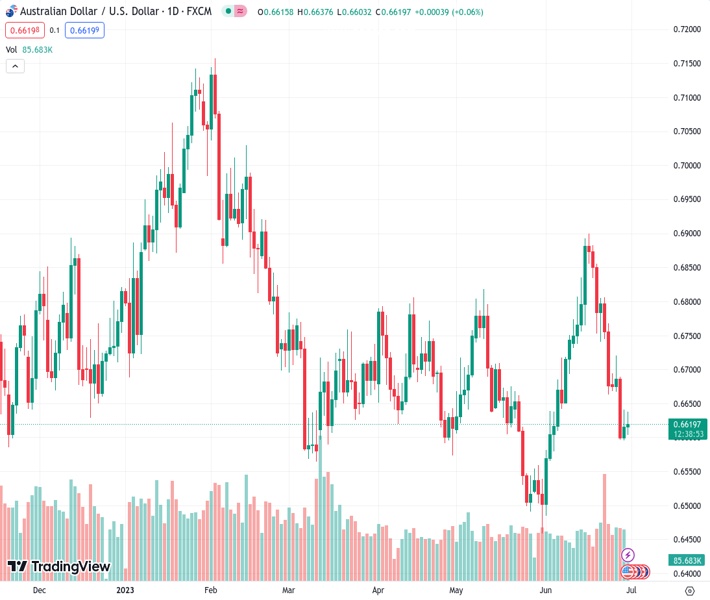
The AUDUSD pair, currently trading at 0.66204, has shown positive movement for two consecutive days. However, it has not been able to maintain this momentum.
…
This is a premium post.
[s2If !current_user_can(access_s2member_level4)]Please register for FREE REGISTER to read full post below containing analysis. In case of any error or you think you are not able to read the full post below, please email us at support#nehcap.com [lwa][/s2If] [s2If current_user_can(access_s2member_level1)]
- AUD/USD gains positive traction for the second straight day, though lacks follow-through.
The pair currently trades last at 0.66204.
The previous day high was 0.6641 while the previous day low was 0.6595. The daily 38.2% Fib levels comes at 0.6623, expected to provide resistance. Similarly, the daily 61.8% fib level is at 0.6613, expected to provide support.
The AUD/USD pair attracts some intraday buying near the 0.6600 round-figure mark, albeit struggles to capitalize on the move and retreats a few pips from the daily peak. Spot prices currently trade around the 0.6620-0.6625 region, up less than 0.15% for the day, and remain well within the striking distance of a nearly four-week low touched on Thursday.
Investors remain worried about economic headwinds stemming from rapidly rising borrowing costs and the fears were further fueled by rather unimpressive Chinese macro data. In fact, the official Chinese Manufacturing PMI improved slightly to 49 for June, from 48.8 previous, though remained in contraction territory for the third straight month. Meanwhile, the gauge for the services sector surpassed consensus estimates and came in at 53.2 for the reported month, though was lower than the 54.5 recorded in May. This, in turn, acts as a headwind for the China-proxy Aussie and caps the AUD/USD pair.
The Australian Dollar (AUD) is further undermined by expectations that the Reserve Bank of Australia (RBA) will refrain from hiking interest rates in July. The bets were lifted by softer domestic data released on Wednesday, which showed that consumer inflation slowed to a 13-month low in May. The US Dollar (USD), on the other hand, stands tall near its highest level since June 13 and remains well supported by the Federal Reserve’s (Fed) hawkish outlook. This, along with the upbeat US macro data released on Thursday, reaffirmed market bets for a 25-bps lift-off at the next FOMC meeting on July 25-26.
The prospects for further policy tightening by the US central bank remain supportive of a further rise in the US Treasury bond yields and continue to lend support to the USD. Market participants, however, seem reluctant to place aggressive bets and prefer to wait for the release of the US PCE Price Index, which will play a key role in influencing expectations about the Fed’s future rate hike path. This, in turn, will drive the USD demand and provide a fresh directional impetus to the AUD/USD pair. Nevertheless, spot prices remain on track to register losses for the second successive week.
Technical Levels: Supports and Resistances
AUDUSD currently trading at 0.6621 at the time of writing. Pair opened at 0.6616 and is trading with a change of 0.08 % .
| Overview | Overview.1 | |
|---|---|---|
| 0 | Today last price | 0.6621 |
| 1 | Today Daily Change | 0.0005 |
| 2 | Today Daily Change % | 0.0800 |
| 3 | Today daily open | 0.6616 |
The pair remains strongly bearish on the daily time frame. It trades below the 20 SMA @ 0.6726, 50 SMA 0.6674, 100 SMA @ 0.6703 and 200 SMA @ 0.6692.
| Trends | Trends.1 | |
|---|---|---|
| 0 | Daily SMA20 | 0.6726 |
| 1 | Daily SMA50 | 0.6674 |
| 2 | Daily SMA100 | 0.6703 |
| 3 | Daily SMA200 | 0.6692 |
The previous day high was 0.6641 while the previous day low was 0.6595. The daily 38.2% Fib levels comes at 0.6623, expected to provide resistance. Similarly, the daily 61.8% fib level is at 0.6613, expected to provide support.
Note the levels of interest below:
- Pivot support is noted at 0.6594, 0.6572, 0.6549
- Pivot resistance is noted at 0.664, 0.6663, 0.6685
| Levels | Levels.1 |
|---|---|
| Previous Daily High | 0.6641 |
| Previous Daily Low | 0.6595 |
| Previous Weekly High | 0.6886 |
| Previous Weekly Low | 0.6663 |
| Previous Monthly High | 0.6818 |
| Previous Monthly Low | 0.6458 |
| Daily Fibonacci 38.2% | 0.6623 |
| Daily Fibonacci 61.8% | 0.6613 |
| Daily Pivot Point S1 | 0.6594 |
| Daily Pivot Point S2 | 0.6572 |
| Daily Pivot Point S3 | 0.6549 |
| Daily Pivot Point R1 | 0.6640 |
| Daily Pivot Point R2 | 0.6663 |
| Daily Pivot Point R3 | 0.6685 |
[/s2If]
Nehcap Expert Advisor
The NEHCAP MT4 EA is high quality professional trading system geared to generate returns without using GRID or martingales. Each trade has strict risk per trade parameter. The pairs under management include EURUSD, GBPUSD, AUDCAD, AUDNZD,GBPAUD, EURAUD, EURCAD, CHFJPY and many more.
The system is trading live: LIVE ACCOUNT TRACKING
You can run it free. Apply for a free trial and track our account. Buy the system or use profit share mechanism to generate returns on your MT4.
Join Our Telegram Group
")


