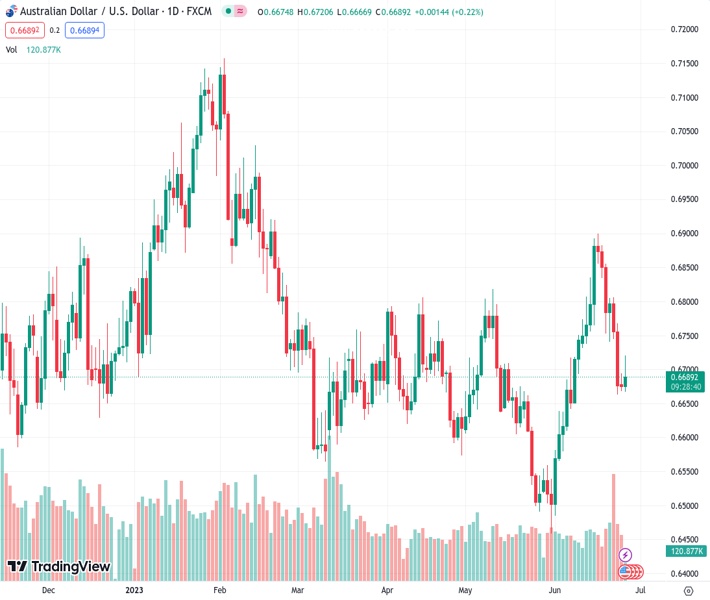
#AUDUSD @ 0.66891 has faced stiff barriers around 0.6720 as the focus shifts to Australian monthly inflation.
…
This is a premium post.
[s2If !current_user_can(access_s2member_level4)]Please register for FREE REGISTER to read full post below containing analysis. In case of any error or you think you are not able to read the full post below, please email us at support#nehcap.com [lwa][/s2If] [s2If current_user_can(access_s2member_level1)]
- AUD/USD has faced stiff barriers around 0.6720 as the focus shifts to Australian monthly inflation.
The pair currently trades last at 0.66891.
The previous day high was 0.6694 while the previous day low was 0.6668. The daily 38.2% Fib levels comes at 0.6678, expected to provide support. Similarly, the daily 61.8% fib level is at 0.6684, expected to provide support.
The AUD/USD pair has retreated after a short-lived recovery to near 0.6720 in the European session. The Aussie asset has faced selling pressure as investors have shifted their focus toward the release of the monthly Australian Consumer Price Index (CPI) data, which will release on Wednesday.
A deceleration is expected in the Australian inflation to 6.1% from the former release of 6.8%, which could allow the Reserve Bank of Australia (RBA) to skip policy-tightening in July. However, a one-time softening of monthly inflation might not be sufficient enough as labor market conditions have tightened.
The US Dollar Index (DXY) looks well-supported around 102.50 ahead of the United States Durable Goods Orders data (May). The economic data is expected to contract by 1.1% against an expansion of 1.1% reported last month.
AUD/USD has shown some strength after dropping to near the 50% Fibonacci retracement (plotted from May 31 low at 0.6458 to June 16 high at 0.6900) at 0.6680 on a two-hour scale. The 50-period Exponential Moving Average (EMA) at 0.6720 is still acting as a barricade for the Australian Dollar bulls.
The Relative Strength Index (RSI) (14) has rebounded into the 40.00-60.00 range from the bearish range of 20.00-40.00, portraying an attempt of a bullish reversal.
A decisive break below the 50% Fibo retracement at 0.6680 would expose the asset to 61.8% Fibo retracement at 0.6628 followed by June 05 low at 0.6579.
On the flip side, a confident break above the round-level resistance of 0.6800 would expose the asset to June 20 high at 0.6855. A break above the latter would drive the asset toward June 16 high at 0.6900.
Technical Levels: Supports and Resistances
AUDUSD currently trading at 0.669 at the time of writing. Pair opened at 0.6675 and is trading with a change of 0.22 % .
| Overview | Overview.1 | |
|---|---|---|
| 0 | Today last price | 0.6690 |
| 1 | Today Daily Change | 0.0015 |
| 2 | Today Daily Change % | 0.2200 |
| 3 | Today daily open | 0.6675 |
The pair is trading below its 20 Daily moving average @ 0.6711, above its 50 Daily moving average @ 0.668 , below its 100 Daily moving average @ 0.6712 and below its 200 Daily moving average @ 0.6692
| Trends | Trends.1 | |
|---|---|---|
| 0 | Daily SMA20 | 0.6711 |
| 1 | Daily SMA50 | 0.6680 |
| 2 | Daily SMA100 | 0.6712 |
| 3 | Daily SMA200 | 0.6692 |
The previous day high was 0.6694 while the previous day low was 0.6668. The daily 38.2% Fib levels comes at 0.6678, expected to provide support. Similarly, the daily 61.8% fib level is at 0.6684, expected to provide support.
Note the levels of interest below:
- Pivot support is noted at 0.6664, 0.6653, 0.6638
- Pivot resistance is noted at 0.669, 0.6705, 0.6717
| Levels | Levels.1 |
|---|---|
| Previous Daily High | 0.6694 |
| Previous Daily Low | 0.6668 |
| Previous Weekly High | 0.6886 |
| Previous Weekly Low | 0.6663 |
| Previous Monthly High | 0.6818 |
| Previous Monthly Low | 0.6458 |
| Daily Fibonacci 38.2% | 0.6678 |
| Daily Fibonacci 61.8% | 0.6684 |
| Daily Pivot Point S1 | 0.6664 |
| Daily Pivot Point S2 | 0.6653 |
| Daily Pivot Point S3 | 0.6638 |
| Daily Pivot Point R1 | 0.6690 |
| Daily Pivot Point R2 | 0.6705 |
| Daily Pivot Point R3 | 0.6717 |
[/s2If]
Nehcap Expert Advisor
The NEHCAP MT4 EA is high quality professional trading system geared to generate returns without using GRID or martingales. Each trade has strict risk per trade parameter. The pairs under management include EURUSD, GBPUSD, AUDCAD, AUDNZD,GBPAUD, EURAUD, EURCAD, CHFJPY and many more.
The system is trading live: LIVE ACCOUNT TRACKING
You can run it free. Apply for a free trial and track our account. Buy the system or use profit share mechanism to generate returns on your MT4.
Join Our Telegram Group
")


