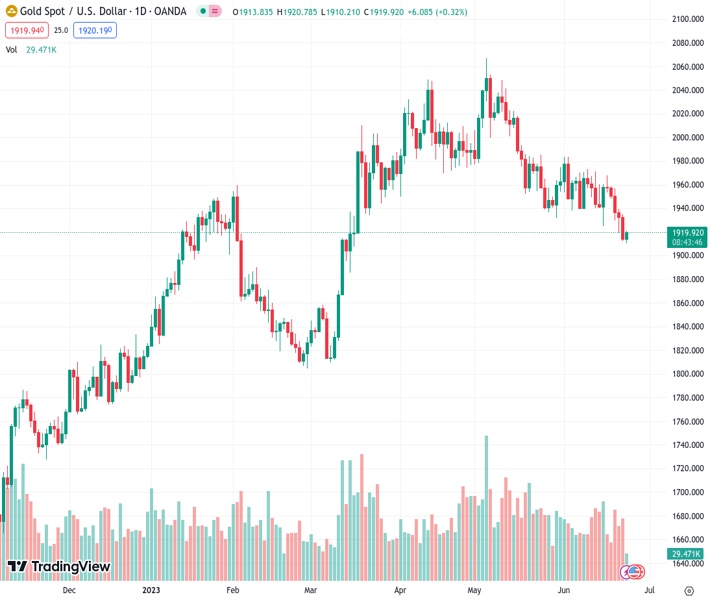
The price of gold, represented as XAUUSD at 1,919.26, has reached almost $1,920.00 as the momentum for the USD Index is slowing down, allowing for a continued recovery.
…
This is a premium post.
[s2If !current_user_can(access_s2member_level4)]Please register for FREE REGISTER to read full post below containing analysis. In case of any error or you think you are not able to read the full post below, please email us at support#nehcap.com [lwa][/s2If] [s2If current_user_can(access_s2member_level1)]
- Gold price has stretched its recovery to near $1,920.00 as the upside momentum in the USD Index is exhausting.
The pair currently trades last at 1919.26.
The previous day high was 1935.06 while the previous day low was 1912.46. The daily 38.2% Fib levels comes at 1921.09, expected to provide resistance. Similarly, the daily 61.8% fib level is at 1926.43, expected to provide resistance.
Gold price (XAU/USD) has stretched its recovery to near $1,920.00 in the European session. The precious metal found strength near $1,912.00 as the US Dollar Index (DXY) has shown signs of exhaustion in the upside momentum.
S&P500 futures have generated immense losses overnight, which are solidifying a negative opening ahead. The overall risk profile is negative as investors are worried about global economic prospects due to a hawkish stance by central banks. The US Dollar Index (DXY) has corrected to near 103.00, however, the upside is still solid as Federal Reserve (Fed) chair Jerome Powell has confirmed that more rate hikes are appropriate but at a careful pace.
Fed Governor Michelle Bowman didn’t specify her estimate of how high the Fed may need to move rates, said on Thursday further “rate increases” were needed – indicating she feels at least two more hikes are warranted, as reported by Reuters.
Going forward, US preliminary S&P PMI (June) will be in focus. Analysts at TD Securities noted that “the S&P PMIs will offer a first comprehensive look at the state of the US economy for early June. Note that the manufacturing PMI registered its first decline this year in May, while the services PMI continued to improve, posting its fifth consecutive gain last month. We expect the manufacturing index to improve but to stay under contraction territory, while the services PMI likely lost speed.”
Gold price has shown a minor recovery to test the breakdown region of the Bearish Wedge chart pattern around $1,921.11 on a two-hour scale. The precious metal is broadly in a negative trajectory. The 20-period Exponential Moving Average (EMA) at $1,921.46 might continue to act as a barricade for the Gold bulls.
The Relative Strength Index (RSI) (14) is oscillating in the bearish range of 20.00-40.00, which indicates that the downside momentum is active.
Technical Levels: Supports and Resistances
XAUUSD currently trading at 1919.23 at the time of writing. Pair opened at 1913.88 and is trading with a change of 0.28 % .
| Overview | Overview.1 | |
|---|---|---|
| 0 | Today last price | 1919.23 |
| 1 | Today Daily Change | 5.35 |
| 2 | Today Daily Change % | 0.28 |
| 3 | Today daily open | 1913.88 |
The pair is trading below its 20 Daily moving average @ 1951.15, below its 50 Daily moving average @ 1978.98 , below its 100 Daily moving average @ 1942.1 and above its 200 Daily moving average @ 1852.09
| Trends | Trends.1 | |
|---|---|---|
| 0 | Daily SMA20 | 1951.15 |
| 1 | Daily SMA50 | 1978.98 |
| 2 | Daily SMA100 | 1942.10 |
| 3 | Daily SMA200 | 1852.09 |
The previous day high was 1935.06 while the previous day low was 1912.46. The daily 38.2% Fib levels comes at 1921.09, expected to provide resistance. Similarly, the daily 61.8% fib level is at 1926.43, expected to provide resistance.
Note the levels of interest below:
- Pivot support is noted at 1905.87, 1897.87, 1883.27
- Pivot resistance is noted at 1928.47, 1943.07, 1951.07
| Levels | Levels.1 |
|---|---|
| Previous Daily High | 1935.06 |
| Previous Daily Low | 1912.46 |
| Previous Weekly High | 1971.01 |
| Previous Weekly Low | 1924.85 |
| Previous Monthly High | 2079.76 |
| Previous Monthly Low | 1932.12 |
| Daily Fibonacci 38.2% | 1921.09 |
| Daily Fibonacci 61.8% | 1926.43 |
| Daily Pivot Point S1 | 1905.87 |
| Daily Pivot Point S2 | 1897.87 |
| Daily Pivot Point S3 | 1883.27 |
| Daily Pivot Point R1 | 1928.47 |
| Daily Pivot Point R2 | 1943.07 |
| Daily Pivot Point R3 | 1951.07 |
[/s2If]
Nehcap Expert Advisor
The NEHCAP MT4 EA is high quality professional trading system geared to generate returns without using GRID or martingales. Each trade has strict risk per trade parameter. The pairs under management include EURUSD, GBPUSD, AUDCAD, AUDNZD,GBPAUD, EURAUD, EURCAD, CHFJPY and many more.
The system is trading live: LIVE ACCOUNT TRACKING
You can run it free. Apply for a free trial and track our account. Buy the system or use profit share mechanism to generate returns on your MT4.
Join Our Telegram Group
")


