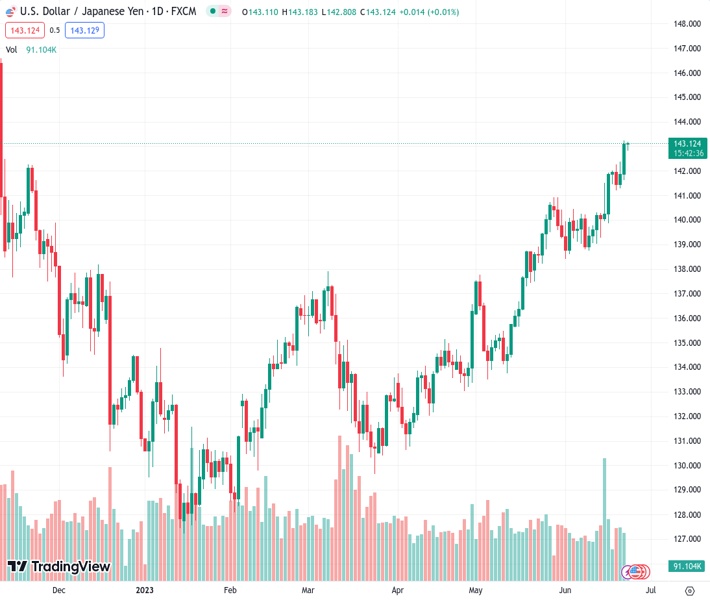
The USDJPY currency pair is fluctuating near its seven-month peak at 143.134 and has achieved a two-day winning trend. However, according to the viewpoint of @nehcap, there are no expectations for significant gains in the near future.
…
This is a premium post.
[s2If !current_user_can(access_s2member_level4)]Please register for FREE REGISTER to read full post below containing analysis. In case of any error or you think you are not able to read the full post below, please email us at support#nehcap.com [lwa][/s2If] [s2If current_user_can(access_s2member_level1)]
- USD/JPY seesaws around the highest levels in seven months, prods two-day winning streak.
The pair currently trades last at 143.134.
The previous day high was 143.23 while the previous day low was 141.61. The daily 38.2% Fib levels comes at 142.61, expected to provide support. Similarly, the daily 61.8% fib level is at 142.23, expected to provide support.
USD/JPY makes rounds to 143.00 amid a lackluster Friday morning in Europe, after refreshing the yearly top the previous day. In doing so, the Yen pair pauses the previous two-day uptrend amid an overbought RSI (14) line. Adding strength to the quote’s latest inaction could be the cautious mood ahead of the US PMIs and fears of the US recession. It’s worth noting that the risk-barometer pair also takes clues from Japan’s mixed inflation data and downbeat PMIs.
Also read: USD/JPY holds steady above 143.00 mark, near its highest level since November 2022
Even if the RSI (14) line prods the USD/JPY buyers with a two-month-old rising wedge bearish chart formation, the quote’s successful break of the 61.8% Fibonacci retracement level of October 2022 to January 2023 downside, near 142.50 at the latest, keeps the bulls hopeful.
It’s worth noting, however, the aforementioned wedge’s top line, around 144.00 by the press time, will challenge the USD/JPY pair’s further upside.
In a case where the Yen pair crosses the 144.00 hurdle, it defies the bearish chart pattern. Though, the October 2022 low near 145.10 can act as the last defense of the bears.
On the contrary, a downside break of the stated key technical level around 142.50, also known as the golden Fibonacci ratio, can direct the USD/JPY bears towards confirming the rising wedge bearish chart pattern, by poking the 140.80 support.
While a clear downside break of 140.80 suggests the USD/JPY pair’s theoretical south-run towards 131.00, the 21-DMA and the 200-DMA, respectively near 140.50 and 137.20, will act as extra checks for the sellers.
Trend: Limited upside expected
Technical Levels: Supports and Resistances
USDJPY currently trading at 143.08 at the time of writing. Pair opened at 143.12 and is trading with a change of -0.03% % .
| Overview | Overview.1 | |
|---|---|---|
| 0 | Today last price | 143.08 |
| 1 | Today Daily Change | -0.04 |
| 2 | Today Daily Change % | -0.03% |
| 3 | Today daily open | 143.12 |
The pair remains strongly bullish on the daily timeframe. It trades above its 20 SMA @ 140.36, 50 SMA 137.61, 100 SMA @ 135.52 and 200 SMA @ 137.21.
| Trends | Trends.1 | |
|---|---|---|
| 0 | Daily SMA20 | 140.36 |
| 1 | Daily SMA50 | 137.61 |
| 2 | Daily SMA100 | 135.52 |
| 3 | Daily SMA200 | 137.21 |
The previous day high was 143.23 while the previous day low was 141.61. The daily 38.2% Fib levels comes at 142.61, expected to provide support. Similarly, the daily 61.8% fib level is at 142.23, expected to provide support.
Note the levels of interest below:
- Pivot support is noted at 142.08, 141.04, 140.46
- Pivot resistance is noted at 143.69, 144.27, 145.31
| Levels | Levels.1 |
|---|---|
| Previous Daily High | 143.23 |
| Previous Daily Low | 141.61 |
| Previous Weekly High | 141.92 |
| Previous Weekly Low | 139.01 |
| Previous Monthly High | 140.93 |
| Previous Monthly Low | 133.50 |
| Daily Fibonacci 38.2% | 142.61 |
| Daily Fibonacci 61.8% | 142.23 |
| Daily Pivot Point S1 | 142.08 |
| Daily Pivot Point S2 | 141.04 |
| Daily Pivot Point S3 | 140.46 |
| Daily Pivot Point R1 | 143.69 |
| Daily Pivot Point R2 | 144.27 |
| Daily Pivot Point R3 | 145.31 |
[/s2If]
Nehcap Expert Advisor
The NEHCAP MT4 EA is high quality professional trading system geared to generate returns without using GRID or martingales. Each trade has strict risk per trade parameter. The pairs under management include EURUSD, GBPUSD, AUDCAD, AUDNZD,GBPAUD, EURAUD, EURCAD, CHFJPY and many more.
The system is trading live: LIVE ACCOUNT TRACKING
You can run it free. Apply for a free trial and track our account. Buy the system or use profit share mechanism to generate returns on your MT4.
Join Our Telegram Group
")


