The GBPUSD exchange rate is currently evaluating its support level around 1.2700, but the prevailing trend towards risk aversion suggests a higher likelihood of a decline in value.
…
This is a premium post.
[s2If !current_user_can(access_s2member_level4)]Please register for FREE REGISTER to read full post below containing analysis. In case of any error or you think you are not able to read the full post below, please email us at support#nehcap.com [lwa][/s2If] [s2If current_user_can(access_s2member_level1)]
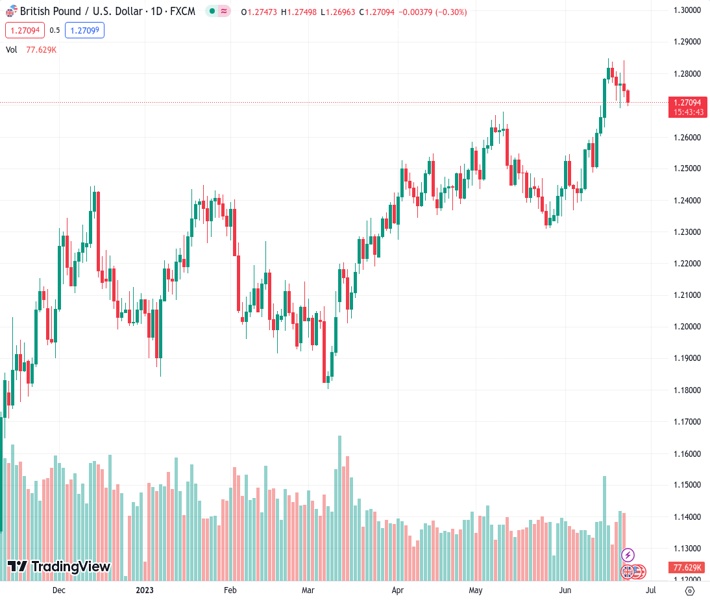
- GBP/USD is gauging support near 1.2700, however, the downside seems favored due to the risk-aversion theme.
The pair currently trades last at 1.27083.
The previous day high was 1.2845 while the previous day low was 1.2726. The daily 38.2% Fib levels comes at 1.2771, expected to provide resistance. Similarly, the daily 61.8% fib level is at 1.28, expected to provide resistance.
The GBP/USD pair has shown a vertical fall to near the round-level support of 1.2700 due to the risk-aversion theme in the Asian session. The Cable is expected to deliver more downside as the hawkish stance by global central banks is threatening the global growth outlook, which has improved the appeal for the US Dollar Index (DXY) significantly.
The US Dollar Index (DXY) has climbed above 102.60 as the Federal Reserve (Fed) chair Jerome Powell has confirmed more interest rate hikes ahead, considering the fact that achievement of 2% inflation has a long way to go.
On Thursday, the Bank of England (BoE) surprisingly announced a fat rate hike and push interest rates to 5% as May’s inflation turned out to be more persistent than expected. Investors are expecting that bigger interest rate hikes from BoE Governor Andrew Bailey will demand the economic outlook of the United Kingdom.
GBP/USD has shown a perpendicular fall after forming a Double Top chart pattern on a four-hour scale around 1.2848. The aforementioned pattern indicates that Pound bulls attempted a breakout with weak buying interest, which triggered US Dollar bulls to take charge. The Double Top chart pattern would trigger if the Cable drops below the crucial support placed at 1.2691.
The Cable has dropped below the 50-period Exponential Moving Average (EMA) at 1.2714, which indicates that the short-term trend has turned bearish.
Adding to that, the Relative Strength Index (RSI) (14) has shifted into the 40.00-60.00 range from the bullish range of 60.00-80.00. This indicates that Pound bulls are not strong anymore and a bearish momentum could initiate if the Cable drops into the bearish range of 20.00-40.00.
Bullish bias for the Cable would strengthen if it manages to climb above the fresh annual high around 1.2850. The bullish bias could be faded if Cable drops below the previous month’s high around 1.2669.
Technical Levels: Supports and Resistances
GBPUSD currently trading at 1.2708 at the time of writing. Pair opened at 1.2748 and is trading with a change of -0.31 % .
| Overview | Overview.1 | |
|---|---|---|
| 0 | Today last price | 1.2708 |
| 1 | Today Daily Change | -0.0000 |
| 2 | Today Daily Change % | -0.3100 |
| 3 | Today daily open | 1.2748 |
The pair remains strongly bullish on the daily timeframe. It trades above its 20 SMA @ 1.2572, 50 SMA 1.2517, 100 SMA @ 1.2342 and 200 SMA @ 1.2069.
| Trends | Trends.1 | |
|---|---|---|
| 0 | Daily SMA20 | 1.2572 |
| 1 | Daily SMA50 | 1.2517 |
| 2 | Daily SMA100 | 1.2342 |
| 3 | Daily SMA200 | 1.2069 |
The previous day high was 1.2845 while the previous day low was 1.2726. The daily 38.2% Fib levels comes at 1.2771, expected to provide resistance. Similarly, the daily 61.8% fib level is at 1.28, expected to provide resistance.
Note the levels of interest below:
- Pivot support is noted at 1.2701, 1.2654, 1.2581
- Pivot resistance is noted at 1.282, 1.2892, 1.2939
| Levels | Levels.1 |
|---|---|
| Previous Daily High | 1.2845 |
| Previous Daily Low | 1.2726 |
| Previous Weekly High | 1.2848 |
| Previous Weekly Low | 1.2487 |
| Previous Monthly High | 1.2680 |
| Previous Monthly Low | 1.2308 |
| Daily Fibonacci 38.2% | 1.2771 |
| Daily Fibonacci 61.8% | 1.2800 |
| Daily Pivot Point S1 | 1.2701 |
| Daily Pivot Point S2 | 1.2654 |
| Daily Pivot Point S3 | 1.2581 |
| Daily Pivot Point R1 | 1.2820 |
| Daily Pivot Point R2 | 1.2892 |
| Daily Pivot Point R3 | 1.2939 |
[/s2If]
Nehcap Expert Advisor
The NEHCAP MT4 EA is high quality professional trading system geared to generate returns without using GRID or martingales. Each trade has strict risk per trade parameter. The pairs under management include EURUSD, GBPUSD, AUDCAD, AUDNZD,GBPAUD, EURAUD, EURCAD, CHFJPY and many more.
The system is trading live: LIVE ACCOUNT TRACKING
You can run it free. Apply for a free trial and track our account. Buy the system or use profit share mechanism to generate returns on your MT4.
Join Our Telegram Group
")


