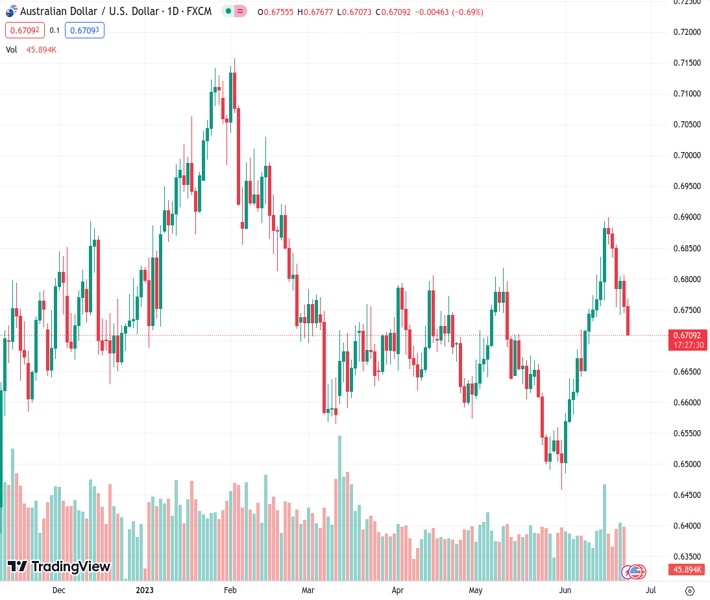
On Friday, after declining for two consecutive days, the AUDUSD currency pair reached a two-week low and continued to move downwards.
…
This is a premium post.
[s2If !current_user_can(access_s2member_level4)]Please register for FREE REGISTER to read full post below containing analysis. In case of any error or you think you are not able to read the full post below, please email us at support#nehcap.com [lwa][/s2If] [s2If current_user_can(access_s2member_level1)]
- AUD/USD drifts lower for the second straight day and drops to a two-week low on Friday.
The pair currently trades last at 0.67093.
The previous day high was 0.6806 while the previous day low was 0.6745. The daily 38.2% Fib levels comes at 0.6768, expected to provide resistance. Similarly, the daily 61.8% fib level is at 0.6783, expected to provide resistance.
The AUD/USD pair remains under some selling pressure for the second successive day on Friday – also marking the fifth day of a negative move in the previous six – and drops to a two-week low during the Asian session. Spot prices currently trade around the 0.6715 area, down 0.60% for the day, and now seems vulnerable to extend its recent pullback from a nearly four-month high touched last week.
The US Dollar (USD) gains some follow-through positive traction on Friday and builds on the previous day’s goodish recovery move from its lowest level since May 11, which, in turn, is seen as a key factor exerting pressure on the AUD/USD pair. Federal Reserve (Fed) Chair Jerome Powell, during his two-day congressional testimony, repeated his view that interest rates will likely rise again this year to combat stubbornly high inflation. This, along with worries about a global economic downturn and a weaker risk tone, benefits the safe-haven buck and drives flows away from the risk-sensitive Aussie.
From a technical perspective, the intraday slide drags the AUD/USD pair below the 38.2% Fibonacci retracement level of the recent rally from the YTD low touched in May and is now flirting with the 100-day Simple Moving Average (SMA). Any subsequent fall is more likely to attract some buyers near the 0.6690-0.6680 confluence – comprising the very important 200-day SMA and the 50% Fibo. level. This should act as a pivotal point, which if broken decisively will set the stage for an extension of the recent rejection slide from the 0.6900 mark, or a nearly four-month high touched last Friday.
The AUD/USD pair might then accelerate the downfall towards the 0.6625 area, or the 61.8% Fibo. level, en route to the 0.6600 round-figure mark. Some follow-through selling will shift the bias in favour of bearish traders and pave the way for a slide towards the 0.6545-0.6540 intermediate support. Spot prices might then aim to challenge the 0.6500 psychological mark before eventually dropping to the YTD low, around the 0.6460-0.6455 region touched in May.
On the flip side, the 0.6730 zone, or the 38.2% Fibo. level, now seems to act as an immediate hurdle ahead of the daily top, near the 0.6765-0.6770 region. The next relevant hurdle is pegged near 23.6% Fibo. level, around the 0.6800 mark. A sustained strength beyond the latter will suggest that the corrective decline has run its course and lift the AUD/USD pair toward the 0.6855-0.6860 resistance. Spot prices might then make a fresh attempt to conquer the 0.6900 mark.
Technical Levels: Supports and Resistances
AUDUSD currently trading at 0.6715 at the time of writing. Pair opened at 0.6756 and is trading with a change of -0.61 % .
| Overview | Overview.1 | |
|---|---|---|
| 0 | Today last price | 0.6715 |
| 1 | Today Daily Change | -0.0041 |
| 2 | Today Daily Change % | -0.6100 |
| 3 | Today daily open | 0.6756 |
The pair is trading above its 20 Daily moving average @ 0.6696, above its 50 Daily moving average @ 0.6681 , below its 100 Daily moving average @ 0.6716 and above its 200 Daily moving average @ 0.6692
| Trends | Trends.1 | |
|---|---|---|
| 0 | Daily SMA20 | 0.6696 |
| 1 | Daily SMA50 | 0.6681 |
| 2 | Daily SMA100 | 0.6716 |
| 3 | Daily SMA200 | 0.6692 |
The previous day high was 0.6806 while the previous day low was 0.6745. The daily 38.2% Fib levels comes at 0.6768, expected to provide resistance. Similarly, the daily 61.8% fib level is at 0.6783, expected to provide resistance.
Note the levels of interest below:
- Pivot support is noted at 0.6732, 0.6708, 0.667
- Pivot resistance is noted at 0.6793, 0.683, 0.6855
| Levels | Levels.1 |
|---|---|
| Previous Daily High | 0.6806 |
| Previous Daily Low | 0.6745 |
| Previous Weekly High | 0.6900 |
| Previous Weekly Low | 0.6732 |
| Previous Monthly High | 0.6818 |
| Previous Monthly Low | 0.6458 |
| Daily Fibonacci 38.2% | 0.6768 |
| Daily Fibonacci 61.8% | 0.6783 |
| Daily Pivot Point S1 | 0.6732 |
| Daily Pivot Point S2 | 0.6708 |
| Daily Pivot Point S3 | 0.6670 |
| Daily Pivot Point R1 | 0.6793 |
| Daily Pivot Point R2 | 0.6830 |
| Daily Pivot Point R3 | 0.6855 |
[/s2If]
Nehcap Expert Advisor
The NEHCAP MT4 EA is high quality professional trading system geared to generate returns without using GRID or martingales. Each trade has strict risk per trade parameter. The pairs under management include EURUSD, GBPUSD, AUDCAD, AUDNZD,GBPAUD, EURAUD, EURCAD, CHFJPY and many more.
The system is trading live: LIVE ACCOUNT TRACKING
You can run it free. Apply for a free trial and track our account. Buy the system or use profit share mechanism to generate returns on your MT4.
Join Our Telegram Group
")


