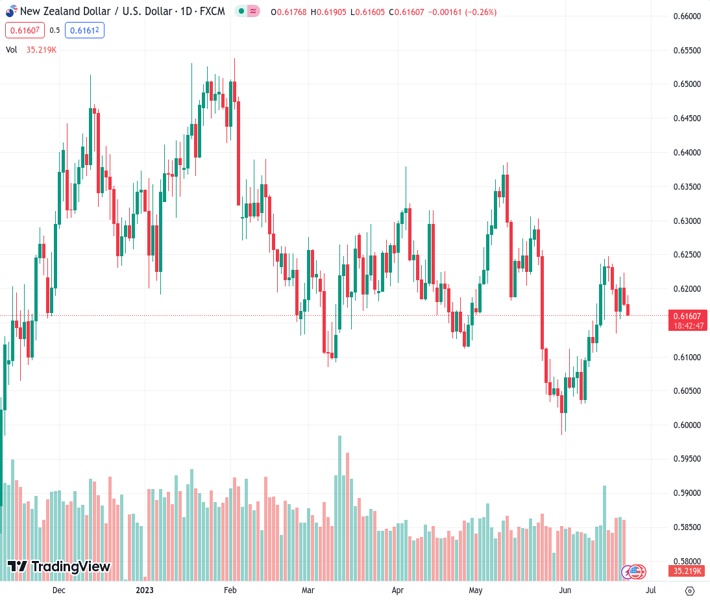
The NZD/USD currency pair at 0.61613 has experienced a consecutive decrease and is being influenced by slight gains in the USD.
…
This is a premium post.
[s2If !current_user_can(access_s2member_level4)]Please register for FREE REGISTER to read full post below containing analysis. In case of any error or you think you are not able to read the full post below, please email us at support#nehcap.com [lwa][/s2If] [s2If current_user_can(access_s2member_level1)]
- NZD/USD turns lower for the second straight day and is pressured by modest USD strength.
The pair currently trades last at 0.61613.
The previous day high was 0.6224 while the previous day low was 0.6173. The daily 38.2% Fib levels comes at 0.6192, expected to provide resistance. Similarly, the daily 61.8% fib level is at 0.6205, expected to provide resistance.
The NZD/USD pair attracts fresh sellers following an early uptick to the 0.6190 region during the Asian session on Friday and turns lower for the second successive day. The pair drops to a fresh daily low, around the 0.6160 area in the last hour, albeit remains well within in a familir trading range held over the past three days.
The US Dollar (USD) gains some follow-through traction on the last day of the week and looks to build on the overnight goodish rebound from its lowest level since May 11, which, in turn, is seen exerting some pressure on the NZD/USD pair. The Federal Reserve (Fed) Chair Jerome Powell, during his two-day congressional testimony, backed the case for more interest rate hikes, albeit at a “careful pace”. Powell added that the Fed doesn’t see rate cuts happening any time soon and is going to wait until it is confident that inflation is moving down to the 2% target. Apart from this, the prevalent cautious mood underpins the safe-haven Greenback and weighs on the risk-sensitive Kiwi.
A slew of rate hikes by major central banks this month fueled concerns about economic headwinds stemming from rapidly rising borrowing costs. This, along with the worsening US-China relations, takes its toll on the global risk sentiment and weighs on antipodean currencies, including the Kiwi. In fact, US President Joe Biden called Chinese President Xi Jinping a dictator, while China’s foreign ministry spokeswoman Mao Ning called Biden’s remarks “extremely absurd and irresponsible”. This comes on the back of the Reserve Bank of New Zealand’s (RBNZ) explicit signal that it was done with its most aggressive hiking cycle since 1999 and further exerts pressure on the NZD/USD pair.
The aforementioned fundamental backdrop suggests that the path of least resistance for spot prices is to the downside. Traders, however, might still need to wait for some follow-through selling below the weekly low, around the 0.6135-0.6130 region, before positioning for any further losses. Nevertheless, the NZD/USD pair remains on track to end in the red for the first week in the previous four. Market participants now look forward to the release of the flash US PMI prints, which might influence the USD and provide some impetus to the NZD/USD pair heading into the weekend.
Technical Levels: Supports and Resistances
NZDUSD currently trading at 0.6169 at the time of writing. Pair opened at 0.6178 and is trading with a change of -0.15 % .
| Overview | Overview.1 | |
|---|---|---|
| 0 | Today last price | 0.6169 |
| 1 | Today Daily Change | -0.0009 |
| 2 | Today Daily Change % | -0.1500 |
| 3 | Today daily open | 0.6178 |
The pair is trading above its 20 Daily moving average @ 0.612, below its 50 Daily moving average @ 0.6175 , below its 100 Daily moving average @ 0.6207 and above its 200 Daily moving average @ 0.6155
| Trends | Trends.1 | |
|---|---|---|
| 0 | Daily SMA20 | 0.6120 |
| 1 | Daily SMA50 | 0.6175 |
| 2 | Daily SMA100 | 0.6207 |
| 3 | Daily SMA200 | 0.6155 |
The previous day high was 0.6224 while the previous day low was 0.6173. The daily 38.2% Fib levels comes at 0.6192, expected to provide resistance. Similarly, the daily 61.8% fib level is at 0.6205, expected to provide resistance.
Note the levels of interest below:
- Pivot support is noted at 0.6159, 0.6141, 0.6108
- Pivot resistance is noted at 0.621, 0.6243, 0.6261
| Levels | Levels.1 |
|---|---|
| Previous Daily High | 0.6224 |
| Previous Daily Low | 0.6173 |
| Previous Weekly High | 0.6250 |
| Previous Weekly Low | 0.6076 |
| Previous Monthly High | 0.6385 |
| Previous Monthly Low | 0.5985 |
| Daily Fibonacci 38.2% | 0.6192 |
| Daily Fibonacci 61.8% | 0.6205 |
| Daily Pivot Point S1 | 0.6159 |
| Daily Pivot Point S2 | 0.6141 |
| Daily Pivot Point S3 | 0.6108 |
| Daily Pivot Point R1 | 0.6210 |
| Daily Pivot Point R2 | 0.6243 |
| Daily Pivot Point R3 | 0.6261 |
[/s2If]
Nehcap Expert Advisor
The NEHCAP MT4 EA is high quality professional trading system geared to generate returns without using GRID or martingales. Each trade has strict risk per trade parameter. The pairs under management include EURUSD, GBPUSD, AUDCAD, AUDNZD,GBPAUD, EURAUD, EURCAD, CHFJPY and many more.
The system is trading live: LIVE ACCOUNT TRACKING
You can run it free. Apply for a free trial and track our account. Buy the system or use profit share mechanism to generate returns on your MT4.
Join Our Telegram Group
")


