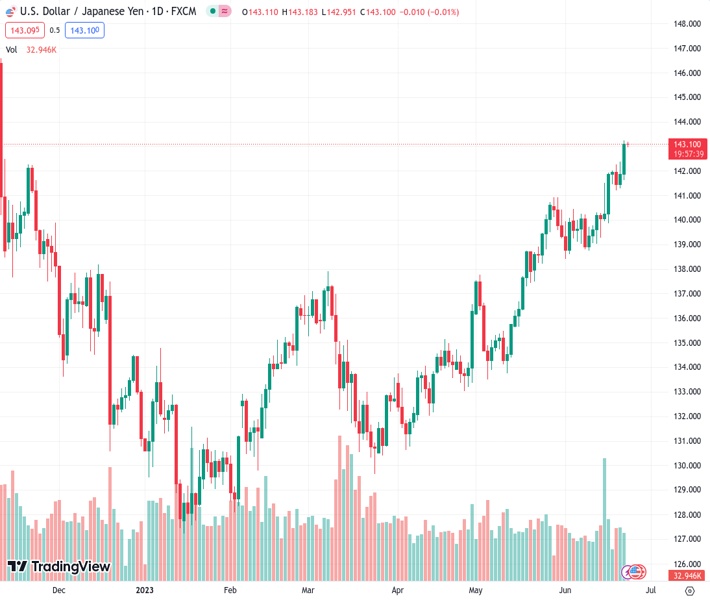
The currency pair USDJPY at a rate of 143.076 is observed to be consolidating its recent strong gains from the previous night, resulting in a new year-to-date high.
…
This is a premium post.
[s2If !current_user_can(access_s2member_level4)]Please register for FREE REGISTER to read full post below containing analysis. In case of any error or you think you are not able to read the full post below, please email us at support#nehcap.com [lwa][/s2If] [s2If current_user_can(access_s2member_level1)]
- USD/JPY is seen consolidating the overnight strong gains to a fresh YTD peak.
The pair currently trades last at 143.076.
The previous day high was 143.23 while the previous day low was 141.61. The daily 38.2% Fib levels comes at 142.61, expected to provide support. Similarly, the daily 61.8% fib level is at 142.23, expected to provide support.
The USD/JPY pair oscillates in a narrow band, just above the 143.00 mark through the Asian session on Friday and consolidates the previous day’s strong rally to a fresh high since November 2022.
The Japanese Yen (JPY) is undermined by a big divergence in the monetary policy stance adopted by the Bank of Japan (BoJ) and other major central banks, which, in turn, acts as a tailwind for the USD/JPY pair. It is worth recalling that the minutes of the April BoJ meeting released on Wednesday showed that the nine-member board saw the need to keep ultra-low interest rates to support the fragile domestic economy. Adding to this, BoJ policymaker Seiji Adachi brushed aside expectations of an early tweak in the yield curve control policy and said that it was too early to phase out ultra-loose monetary policy due to uncertainty over the price outlook.
In contrast, Federal Reserve (Fed) Chair Jerome Powell, during the second day of congressional testimony, backed the case for more interest rate hikes in the US, albeit at a “careful pace”. Powell added that we don’t see rate cuts happening any time soon and the Fed is going to wait until it is confident that inflation is moving down to the 2% target. This, in turn, assists the US Dollar (USD) to preserve the overnight recovery gains from its lowest level since May 11 and lends additional support to the USD/JPY pair. That said, slightly overbought conditions on the daily chart hold back traders from placing fresh bullish bets and capping the upside.
Furthermore, worries about economic headwinds stemming from rapidly rising borrowing costs weigh on investors’ sentiment, which seems to benefit the safe-haven JPY and contributes to keeping a lid on further gains, at least for now. Nevertheless, the aforementioned fundamental backdrop seems tilted firmly in favour of bullish traders and suggests that the path of least resistance for the USD/JPY pair is to the upside. Hence, any intraday pullback might still be seen as a buying opportunity and remain limited. Market participants now look to the release of the flash US PMI prints for short-term trading opportunities on the last day of the week.
Technical Levels: Supports and Resistances
USDJPY currently trading at 143.09 at the time of writing. Pair opened at 143.12 and is trading with a change of -0.02 % .
| Overview | Overview.1 | |
|---|---|---|
| 0 | Today last price | 143.09 |
| 1 | Today Daily Change | -0.03 |
| 2 | Today Daily Change % | -0.02 |
| 3 | Today daily open | 143.12 |
The pair remains strongly bullish on the daily timeframe. It trades above its 20 SMA @ 140.36, 50 SMA 137.61, 100 SMA @ 135.52 and 200 SMA @ 137.21.
| Trends | Trends.1 | |
|---|---|---|
| 0 | Daily SMA20 | 140.36 |
| 1 | Daily SMA50 | 137.61 |
| 2 | Daily SMA100 | 135.52 |
| 3 | Daily SMA200 | 137.21 |
The previous day high was 143.23 while the previous day low was 141.61. The daily 38.2% Fib levels comes at 142.61, expected to provide support. Similarly, the daily 61.8% fib level is at 142.23, expected to provide support.
Note the levels of interest below:
- Pivot support is noted at 142.08, 141.04, 140.46
- Pivot resistance is noted at 143.69, 144.27, 145.31
| Levels | Levels.1 |
|---|---|
| Previous Daily High | 143.23 |
| Previous Daily Low | 141.61 |
| Previous Weekly High | 141.92 |
| Previous Weekly Low | 139.01 |
| Previous Monthly High | 140.93 |
| Previous Monthly Low | 133.50 |
| Daily Fibonacci 38.2% | 142.61 |
| Daily Fibonacci 61.8% | 142.23 |
| Daily Pivot Point S1 | 142.08 |
| Daily Pivot Point S2 | 141.04 |
| Daily Pivot Point S3 | 140.46 |
| Daily Pivot Point R1 | 143.69 |
| Daily Pivot Point R2 | 144.27 |
| Daily Pivot Point R3 | 145.31 |
[/s2If]
Nehcap Expert Advisor
The NEHCAP MT4 EA is high quality professional trading system geared to generate returns without using GRID or martingales. Each trade has strict risk per trade parameter. The pairs under management include EURUSD, GBPUSD, AUDCAD, AUDNZD,GBPAUD, EURAUD, EURCAD, CHFJPY and many more.
The system is trading live: LIVE ACCOUNT TRACKING
You can run it free. Apply for a free trial and track our account. Buy the system or use profit share mechanism to generate returns on your MT4.
Join Our Telegram Group
")


