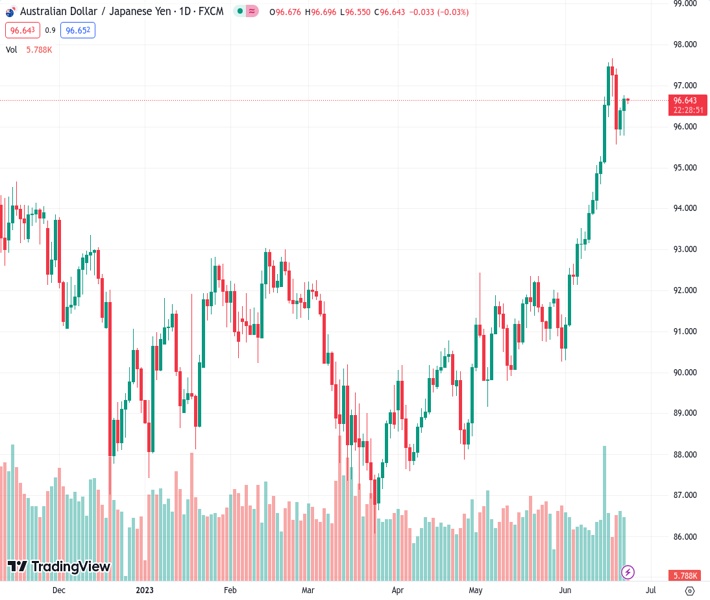
The AUDJPY currency pair has experienced a small rebound, but it is still facing downward pressure, having incurred a weekly loss of 0.84%. It is currently trading at 96.6800.
…
This is a premium post.
[s2If !current_user_can(access_s2member_level4)]Please register for FREE REGISTER to read full post below containing analysis. In case of any error or you think you are not able to read the full post below, please email us at support#nehcap.com [lwa][/s2If] [s2If current_user_can(access_s2member_level1)]
- AUD/JPY sees minor recovery but remains under pressure with a 0.84% weekly loss.
The pair currently trades last at 96.6800.
The previous day high was 96.47 while the previous day low was 95.78. The daily 38.2% Fib levels comes at 96.21, expected to provide support. Similarly, the daily 61.8% fib level is at 96.05, expected to provide support.
The AUD/JPY recovers some ground following Tuesday’s loss of more than 1%, posting back-to-back days of gains, though it remains at around the September 20 daily high at 96.54. As Friday’s Asian session begins, the AUD/JPY exchanges hands at 96.63, registering minimal losses of 0.05%.
The AUD/JPY is still trading with losses of 0.84% in the week but remains upward-biased as price action sits above the Ichimoku Cloud. Nevertheless, the Tenkan-Sen level, at 95.82, is closing into the candlestick, suggesting that the uptrend is losing momentum, opening the door for a pullback.
In addition, the Relative Strength Index (RSI) indicator exited from overbought territory. At the same time, the three-day Rate of Change (RoC) portrays buyers losing momentum. Hence, the AUD/JPY path of least resistance is downward in the near term.
The AUD/JPY first support would be the 96.00 figure. Break below will tumble the AUD/JPY pair toward the Tenkan-Sen Level at 95.82. The AUD/JPY next stop would be the Senkou Span A at 94.89, and the Kijun-Sen Level at 93.96.
Conversely, if AUD/JPY resumes upwards and breaks above the June 19 low of 96.73, the 97.00 figure would be up for grabs. Upside risks lie at the year-to-date (YTD) high of 97.67, ahead of challenging last year’s high at 98.59.
Technical Levels: Supports and Resistances
AUDJPY currently trading at 96.66 at the time of writing. Pair opened at 96.44 and is trading with a change of 0.23 % .
| Overview | Overview.1 | |
|---|---|---|
| 0 | Today last price | 96.66 |
| 1 | Today Daily Change | 0.22 |
| 2 | Today Daily Change % | 0.23 |
| 3 | Today daily open | 96.44 |
The pair remains strongly bullish on the daily timeframe. It trades above its 20 SMA @ 93.71, 50 SMA 91.8, 100 SMA @ 90.95 and 200 SMA @ 91.74.
| Trends | Trends.1 | |
|---|---|---|
| 0 | Daily SMA20 | 93.71 |
| 1 | Daily SMA50 | 91.80 |
| 2 | Daily SMA100 | 90.95 |
| 3 | Daily SMA200 | 91.74 |
The previous day high was 96.47 while the previous day low was 95.78. The daily 38.2% Fib levels comes at 96.21, expected to provide support. Similarly, the daily 61.8% fib level is at 96.05, expected to provide support.
Note the levels of interest below:
- Pivot support is noted at 95.99, 95.54, 95.3
- Pivot resistance is noted at 96.68, 96.92, 97.37
| Levels | Levels.1 |
|---|---|
| Previous Daily High | 96.47 |
| Previous Daily Low | 95.78 |
| Previous Weekly High | 97.63 |
| Previous Weekly Low | 93.88 |
| Previous Monthly High | 92.44 |
| Previous Monthly Low | 89.16 |
| Daily Fibonacci 38.2% | 96.21 |
| Daily Fibonacci 61.8% | 96.05 |
| Daily Pivot Point S1 | 95.99 |
| Daily Pivot Point S2 | 95.54 |
| Daily Pivot Point S3 | 95.30 |
| Daily Pivot Point R1 | 96.68 |
| Daily Pivot Point R2 | 96.92 |
| Daily Pivot Point R3 | 97.37 |
[/s2If]
Nehcap Expert Advisor
The NEHCAP MT4 EA is high quality professional trading system geared to generate returns without using GRID or martingales. Each trade has strict risk per trade parameter. The pairs under management include EURUSD, GBPUSD, AUDCAD, AUDNZD,GBPAUD, EURAUD, EURCAD, CHFJPY and many more.
The system is trading live: LIVE ACCOUNT TRACKING
You can run it free. Apply for a free trial and track our account. Buy the system or use profit share mechanism to generate returns on your MT4.
Join Our Telegram Group
")


