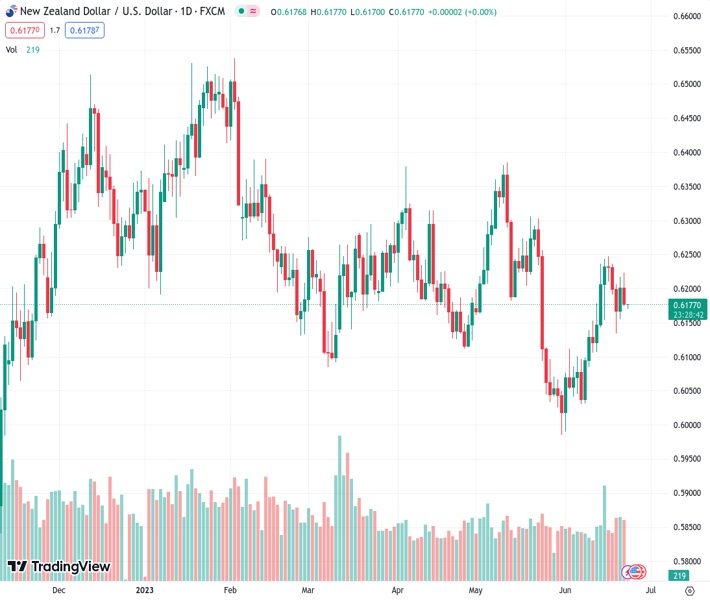
The NZDUSD pair changed direction during the American session, dropping from 0.6222 to 0.6180 after reaching a peak.
…
This is a premium post.
[s2If !current_user_can(access_s2member_level4)]Please register for FREE REGISTER to read full post below containing analysis. In case of any error or you think you are not able to read the full post below, please email us at support#nehcap.com [lwa][/s2If] [s2If current_user_can(access_s2member_level1)]
- The NZD/USD reversed its course during the American session, falling from a high of 0.6222 to 0.6180.
The pair currently trades last at 0.61770.
The previous day high was 0.6219 while the previous day low was 0.6156. The daily 38.2% Fib levels comes at 0.6195, expected to provide resistance. Similarly, the daily 61.8% fib level is at 0.618, expected to provide resistance.
On Thursday, the NZD/USD cleared daily gains, which saw the pair jumping to a daily high of 0.6222 past the 100-day Simple Moving Average (SMA). However. it failed to consolidate above it and retreated to 0.6180. In that sense, hawkish remarks by Jerome Powell during his testimony before the US Senate fueled US bond yields and helped the Greenback gain traction. On the New Zealand side, no relevant reports will be released on Thursday.
In his appearance before the US Senate’s Banking, House, and Urban Affairs Committee, Powell reiterated that the central bank has a considerable distance to cover. He provided reassurance that monetary policy remains effective in its efforts to combat inflation. Chair Powell also confirmed that the Federal Open Market Committee (FOMC) generally believes that raising rates once more this year and potentially twice more would be appropriate. As a reaction, the 2-year bond yield jumped to its highest level since March to 4.8% and gave further traction to the USD.
On the other hand, the US Bureau of Census Analysis revealed 260K Jobless Claims for the week ending June 16, slightly exceeding the expected 262,000. Additionally, the Chicago Fed National Activity index contracted by 0.15 in May vs the consensus of 0, and Existing Home Sales reached 4.3M, surpassing the consensus estimate of 4.25M, indicating resilience in the housing sector.
Attention now turns to the release of the S&P Global PMIs on Friday, where investors will get a clear outlook regarding the US economy’s health.
According to the daily chart, the NZD/USD holds a neutral outlook for the short term as indicators have turned flat but slightly tilted to the downside. In addition, the 20-,100- and 200-day Simple Moving Averages are converging towards the 0.6150 levels and potential bullish or bearish crosses may determine the short-term trajectory.
On the downside, support levels line up at the 200- and 20-day SMAs at 0.6153 and 0.6118 respectively, followed then by the 0.6100 area. On the upside, the 100-day SMA at 0.6205, the daily high at 0.6222 and the 0.6250 area stand as short-term resistances.
Technical Levels: Supports and Resistances
NZDUSD currently trading at 0.6178 at the time of writing. Pair opened at 0.6202 and is trading with a change of -0.39 % .
| Overview | Overview.1 | |
|---|---|---|
| 0 | Today last price | 0.6178 |
| 1 | Today Daily Change | -0.0024 |
| 2 | Today Daily Change % | -0.3900 |
| 3 | Today daily open | 0.6202 |
The pair is trading above its 20 Daily moving average @ 0.6114, above its 50 Daily moving average @ 0.6177 , below its 100 Daily moving average @ 0.621 and above its 200 Daily moving average @ 0.6154
| Trends | Trends.1 | |
|---|---|---|
| 0 | Daily SMA20 | 0.6114 |
| 1 | Daily SMA50 | 0.6177 |
| 2 | Daily SMA100 | 0.6210 |
| 3 | Daily SMA200 | 0.6154 |
The previous day high was 0.6219 while the previous day low was 0.6156. The daily 38.2% Fib levels comes at 0.6195, expected to provide resistance. Similarly, the daily 61.8% fib level is at 0.618, expected to provide resistance.
Note the levels of interest below:
- Pivot support is noted at 0.6166, 0.6129, 0.6103
- Pivot resistance is noted at 0.6229, 0.6255, 0.6292
| Levels | Levels.1 |
|---|---|
| Previous Daily High | 0.6219 |
| Previous Daily Low | 0.6156 |
| Previous Weekly High | 0.6250 |
| Previous Weekly Low | 0.6076 |
| Previous Monthly High | 0.6385 |
| Previous Monthly Low | 0.5985 |
| Daily Fibonacci 38.2% | 0.6195 |
| Daily Fibonacci 61.8% | 0.6180 |
| Daily Pivot Point S1 | 0.6166 |
| Daily Pivot Point S2 | 0.6129 |
| Daily Pivot Point S3 | 0.6103 |
| Daily Pivot Point R1 | 0.6229 |
| Daily Pivot Point R2 | 0.6255 |
| Daily Pivot Point R3 | 0.6292 |
[/s2If]
Nehcap Expert Advisor
The NEHCAP MT4 EA is high quality professional trading system geared to generate returns without using GRID or martingales. Each trade has strict risk per trade parameter. The pairs under management include EURUSD, GBPUSD, AUDCAD, AUDNZD,GBPAUD, EURAUD, EURCAD, CHFJPY and many more.
The system is trading live: LIVE ACCOUNT TRACKING
You can run it free. Apply for a free trial and track our account. Buy the system or use profit share mechanism to generate returns on your MT4.
Join Our Telegram Group
")


