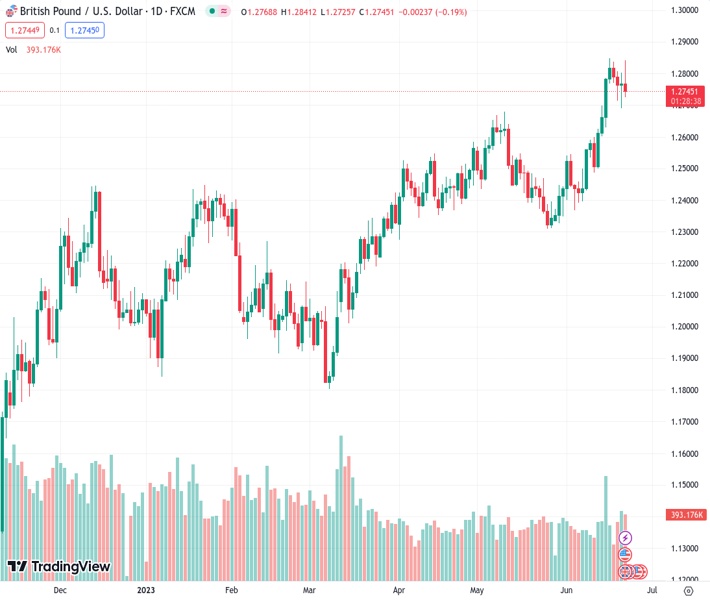
The GBPUSD has decreased by 0.26% to 1.27438 due to the Bank of England’s unforeseen increase of 50 basis points in interest rates, resulting in concerns about a potential recession.
…
This is a premium post.
[s2If !current_user_can(access_s2member_level4)]Please register for FREE REGISTER to read full post below containing analysis. In case of any error or you think you are not able to read the full post below, please email us at support#nehcap.com [lwa][/s2If] [s2If current_user_can(access_s2member_level1)]
- GBP/USD loses 0.26% as BoE’s unexpected 50 bps rate hike raises recession fears.
The pair currently trades last at 1.27438.
The previous day high was 1.2803 while the previous day low was 1.2691. The daily 38.2% Fib levels comes at 1.276, expected to provide resistance. Similarly, the daily 61.8% fib level is at 1.2734, expected to provide support.
GBP/USD extended its losses after hitting a daily high of 1.2841 after the Bank of England (BoE) surprised the markets by hiking rates 50 bps but failed to underpin the Pound Sterling (GBP). Late in the New York session, the GBP/USD is trading at 1.2735, down 0.26%.
On Thursday, the BoE’s decision to lift rates to the 5% threshold caught off guard market participants, which foresaw a quarter of a percent increase to the Bank Rate. But Wednesday, inflation data in the United Kingdom (UK) spurred an aggressive reaction by Andrew Bailey and Co, a sign seen by investors that the central bank is behind the curve.
The BoE’s decision deepened an inversion of the 2 to 10-year curve in GILTs, a sign that investors expect a recession in the British economy.
On Wednesday, UK’s inflation data revealed Office for National Statistics (ONS) saw the Consumer Price Index (CPI) at 8.7% YoY in May vs. projections for an 8.4% drop, while core CPI stood at its highest level since 1992 at 7.1%.
The GBP/USD lost traction after the BoE’s decision due to renewed fears that higher interest rates in the UK could trigger a recession. GBP/USD skyrocketed toward its daily high before stabilizing at around 1.2770. After that, GBP/USD returned most of its gains, reaching a low of 1.2725, before settling around current exchange rates.
Across the pond, the US economic agenda featured the second-day testimony of the Federal Reserve Chair Jerome Powell. Powell reiterated his posture, agreeing with the dot plots, as he said: “We (Fed) think we are within a couple of rate hikes of the level we need to be.” He emphatically commented no rate cuts are expected and will have to wait until the Fed is confident that inflation is slowing towards its 2% target.
Data-wise, the US Bureau of Labor Statistics (BLS) revealed that Initial Jobless Claims reached their highest level since October 2021, growing by 264K exceeding estimates of 260K. At the same time, the US Commerce Department released the US Current Account widened to $219.3 billion in Q1, from a revised $216.2 billion in Q4 2022, exceeding estimates of $217.5 billion.
Existing Home Sales in May grew at a 0.2% MoM pace, above estimates of a -0.5% plunge, more than the upward revised April-s -3.2% contraction.
The UK economic docket will feature Retail Sales for May and S&P Global PMIs. On the US front, the agenda will reveal S&P Global PMI data and Federal Reserve officials crossing the newswires.
Technical Levels: Supports and Resistances
GBPUSD currently trading at 1.2745 at the time of writing. Pair opened at 1.277 and is trading with a change of -0.2 % .
| Overview | Overview.1 | |
|---|---|---|
| 0 | Today last price | 1.2745 |
| 1 | Today Daily Change | -0.0025 |
| 2 | Today Daily Change % | -0.2000 |
| 3 | Today daily open | 1.2770 |
The pair remains strongly bullish on the daily timeframe. It trades above its 20 SMA @ 1.2551, 50 SMA 1.2513, 100 SMA @ 1.2336 and 200 SMA @ 1.2063.
| Trends | Trends.1 | |
|---|---|---|
| 0 | Daily SMA20 | 1.2551 |
| 1 | Daily SMA50 | 1.2513 |
| 2 | Daily SMA100 | 1.2336 |
| 3 | Daily SMA200 | 1.2063 |
The previous day high was 1.2803 while the previous day low was 1.2691. The daily 38.2% Fib levels comes at 1.276, expected to provide resistance. Similarly, the daily 61.8% fib level is at 1.2734, expected to provide support.
Note the levels of interest below:
- Pivot support is noted at 1.2707, 1.2643, 1.2595
- Pivot resistance is noted at 1.2818, 1.2866, 1.2929
| Levels | Levels.1 |
|---|---|
| Previous Daily High | 1.2803 |
| Previous Daily Low | 1.2691 |
| Previous Weekly High | 1.2848 |
| Previous Weekly Low | 1.2487 |
| Previous Monthly High | 1.2680 |
| Previous Monthly Low | 1.2308 |
| Daily Fibonacci 38.2% | 1.2760 |
| Daily Fibonacci 61.8% | 1.2734 |
| Daily Pivot Point S1 | 1.2707 |
| Daily Pivot Point S2 | 1.2643 |
| Daily Pivot Point S3 | 1.2595 |
| Daily Pivot Point R1 | 1.2818 |
| Daily Pivot Point R2 | 1.2866 |
| Daily Pivot Point R3 | 1.2929 |
[/s2If]
Nehcap Expert Advisor
The NEHCAP MT4 EA is high quality professional trading system geared to generate returns without using GRID or martingales. Each trade has strict risk per trade parameter. The pairs under management include EURUSD, GBPUSD, AUDCAD, AUDNZD,GBPAUD, EURAUD, EURCAD, CHFJPY and many more.
The system is trading live: LIVE ACCOUNT TRACKING
You can run it free. Apply for a free trial and track our account. Buy the system or use profit share mechanism to generate returns on your MT4.
Join Our Telegram Group
")


