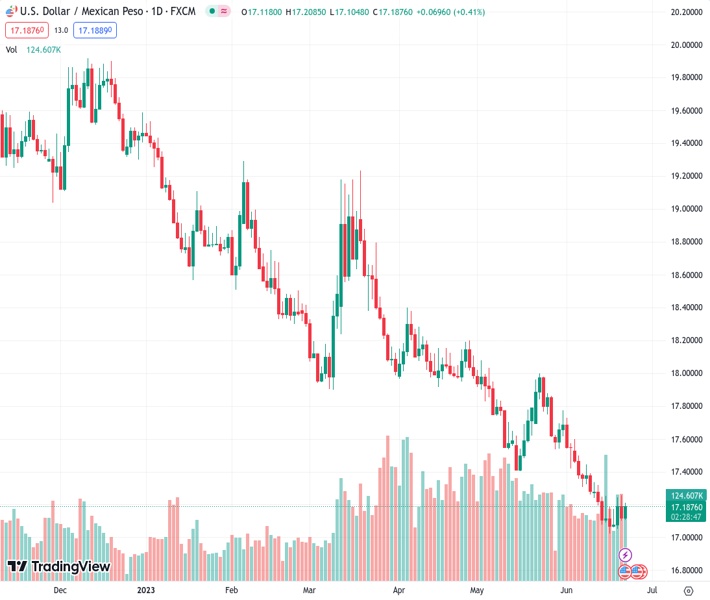
The USDMXN at a rate of 17.1865 goes up by 0.28%, supported by a strong USD and increased US bond yields.
…
This is a premium post.
[s2If !current_user_can(access_s2member_level4)]Please register for FREE REGISTER to read full post below containing analysis. In case of any error or you think you are not able to read the full post below, please email us at support#nehcap.com [lwa][/s2If] [s2If current_user_can(access_s2member_level1)]
- USD/MXN ascends by 0.28%, buoyed by a robust USD and higher US bond yields.
The pair currently trades last at 17.1865.
The previous day high was 17.2576 while the previous day low was 17.106. The daily 38.2% Fib levels comes at 17.1639, expected to provide support. Similarly, the daily 61.8% fib level is at 17.1997, expected to provide resistance.
The USD/MXN pair advances during the North American session on mixed market sentiment, underpinned by higher US bond yields and a solid US Dollar (USD). Traders’ focus is on the Bank of Mexico (Banxico) monetary policy decision late in the New York session. The USD/MXN is trading at 17.1824, up 0.38%.
US equities trade mixed as stocks fluctuated between gains and losses, a headwind for the USD/MXN. Major European central banks raising rates, led by the Bank of England (BoE) hiking rates by 50 bps, spurred recessionary fears as banks struggled to curb inflation.
The USD/MXN printed a leg-up supported by comments the Federal Reserve Chair Jerome Powell reiterated his Wednesday stance, at the one expressed by the dot-plots, as he said: “We (Fed) think we are within a couple of rate hikes of the level we need to be.” He emphatically commented no rate cuts are expected and will have to wait until the Fed is confident that inflation is slowing towards its 2% target.
Data-wise, the US Bureau of Labor Statistics (BLS) revealed that Initial Jobless Claims reached their highest level since October 2021, growing by 264K exceeding estimates of 260K. At the same time, the US Commerce Department released the US Current Account widened to $219.3 billion in Q1, from a revised $216.2 billion in Q4 2022, exceeding estimates of $217.5 billion.
Recently crossing the wires, Existing Home Sales in May grew at a 0.2% MoM pace, above estimates of a -0.5% plunge, more than the upward revised April-s -3.2% contraction.
Aside from this, Banxico is expected to keep rates unchanged at 11.25%, though set to remain at higher levels, as stressed by the bank’s Governing Council in its May meeting. Bank of Mexico Governor Victoria Rodriguez Ceja commented the central bank needs to be cautious as the bank faces a complex outlook and uncertainty regarding monetary policy. She added that keeping rates at their current level would be required for a prolonged period.
Banxico’s monetary policy decision would be due at around 19:00 GMT. The US economic agenda will feature the release of S&P Global PMIs and the Fed parade, which would keep USD/MXN traders entertained.
The USD/MXN continues to bottom at around 17.00 during the last seven days. But in the medium term, the USD/MXN remains downward biased, threatening to dive below the 17.00 handle, eyeing October 2015 lows of 16.3267 as it continues on its way towards the 16.0000 mark. Oscillators support the thesis of the Mexican Peso (MXN) strengthening, as the Relative Strength Index (RSI) sits at bearish territory, while the three-day Rate of Change (RoC) shows that buyers are gathering momentum.
If USD/MXN holds its ground above 17.00, that will increase buyers’ odds of reaching the 20-day Exponential Moving Average (EMA) at 17.3215, as the pair edged toward the May 16 low of 17.4038.
Technical Levels: Supports and Resistances
USDMXN currently trading at 17.1885 at the time of writing. Pair opened at 17.119 and is trading with a change of 0.41 % .
| Overview | Overview.1 | |
|---|---|---|
| 0 | Today last price | 17.1885 |
| 1 | Today Daily Change | 0.0695 |
| 2 | Today Daily Change % | 0.4100 |
| 3 | Today daily open | 17.1190 |
The pair remains strongly bearish on the daily time frame. It trades below the 20 SMA @ 17.3815, 50 SMA 17.6709, 100 SMA @ 18.0521 and 200 SMA @ 18.8047.
| Trends | Trends.1 | |
|---|---|---|
| 0 | Daily SMA20 | 17.3815 |
| 1 | Daily SMA50 | 17.6709 |
| 2 | Daily SMA100 | 18.0521 |
| 3 | Daily SMA200 | 18.8047 |
The previous day high was 17.2576 while the previous day low was 17.106. The daily 38.2% Fib levels comes at 17.1639, expected to provide support. Similarly, the daily 61.8% fib level is at 17.1997, expected to provide resistance.
Note the levels of interest below:
- Pivot support is noted at 17.0642, 17.0094, 16.9127
- Pivot resistance is noted at 17.2157, 17.3124, 17.3673
| Levels | Levels.1 |
|---|---|
| Previous Daily High | 17.2576 |
| Previous Daily Low | 17.1060 |
| Previous Weekly High | 17.3353 |
| Previous Weekly Low | 17.0243 |
| Previous Monthly High | 18.0780 |
| Previous Monthly Low | 17.4203 |
| Daily Fibonacci 38.2% | 17.1639 |
| Daily Fibonacci 61.8% | 17.1997 |
| Daily Pivot Point S1 | 17.0642 |
| Daily Pivot Point S2 | 17.0094 |
| Daily Pivot Point S3 | 16.9127 |
| Daily Pivot Point R1 | 17.2157 |
| Daily Pivot Point R2 | 17.3124 |
| Daily Pivot Point R3 | 17.3673 |
[/s2If]
Nehcap Expert Advisor
The NEHCAP MT4 EA is high quality professional trading system geared to generate returns without using GRID or martingales. Each trade has strict risk per trade parameter. The pairs under management include EURUSD, GBPUSD, AUDCAD, AUDNZD,GBPAUD, EURAUD, EURCAD, CHFJPY and many more.
The system is trading live: LIVE ACCOUNT TRACKING
You can run it free. Apply for a free trial and track our account. Buy the system or use profit share mechanism to generate returns on your MT4.
Join Our Telegram Group
")


