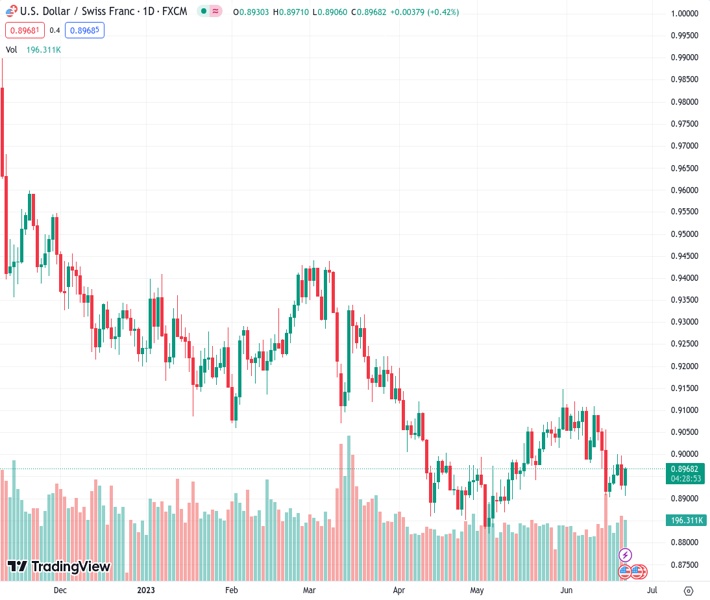
The currency pair USDCHF, which was trading at 0.89669, received assistance at a bottom rate of 0.8905 and then rose to 0.8965.
…
This is a premium post.
[s2If !current_user_can(access_s2member_level4)]Please register for FREE REGISTER to read full post below containing analysis. In case of any error or you think you are not able to read the full post below, please email us at support#nehcap.com [lwa][/s2If] [s2If current_user_can(access_s2member_level1)]
- USD/CHF found support at a low of 0.8905 and then jumped to 0.8965.
The pair currently trades last at 0.89669.
The previous day high was 0.8998 while the previous day low was 0.892. The daily 38.2% Fib levels comes at 0.895, expected to provide support. Similarly, the daily 61.8% fib level is at 0.8968, expected to provide resistance.
On Thursday, the USD/CHF showed volatility – falling to a daily low of 0.8905 and then recovering to 0.8965. Initially, the CHF gained some traction after the Swiss National Bank (SNB) hiked rates by 25 basis points, but the rise in US bond yields, following US data and Federal Reserve (Fed) Chairman Jerome Powell’s testimony, limited the Swiss currency’s upside potential.
The Swiss National Bank raised its key rates by 25 basis points (bps), as the markets expected, to 1.75%. In addition, in the statement, the bank noted that It cannot be ruled out that additional rises in the SNB policy rate will be necessary to ensure price stability over the medium term. Moreover, they stated that they expect GDP to remain robust and that the unemployment rate will increase slightly. The announcement strengthened the Swiss Franc, pushing USD/CHF south, as higher interest rates tend to attract inflows of foreign capital.
The US Bureau Census of Analysis released the Jobless Claims for the week ending on June 16, which came in at 264K vs the 262k expected and from the previous 260k reading. In addition, the Chicago Fed National Activity index came in at 0.15 contraction vs the consensus, which had been for the reading to remain unchanged. Moreover, Existing home sales data showed strength in the housing sector as they came in at 4.3M vs the 4.25M expected by the consensus.
Furthermore, during his second testimony before the US Congress, Jerome Powell, chair of the Federal Reserve (Fed) noted that the Federal Open Market Committee (FOMC) broadly feels it will be suitable to raise rates again this year and perhaps two more times. As a reaction, shorter-term US bond yields rose, with the 2-year rate jumping to its highest level since Friday to 4.78%, seeing a 1% increase. This supported the US Dollar and led USD/CHF to recover.
According to the daily chart, despite indicators gaining some traction, the general outlook is still negative. The Relative Strength Index (RSI) and Moving Average Convergence Divergence (MACD) stand in negative territory, indicating that the bears have the upperhand.
Resistance levels to watch: 0.90, 0.9010 and the 20-day Simple Moving Average (SMA), 0.9025.
Support Levels to watch: 0.8930, 0.8905 (daily low), 0.89 (psychological mark).
Technical Levels: Supports and Resistances
USDCHF currently trading at 0.8968 at the time of writing. Pair opened at 0.8931 and is trading with a change of 0.41 % .
| Overview | Overview.1 | |
|---|---|---|
| 0 | Today last price | 0.8968 |
| 1 | Today Daily Change | 0.0037 |
| 2 | Today Daily Change % | 0.4100 |
| 3 | Today daily open | 0.8931 |
The pair remains strongly bearish on the daily time frame. It trades below the 20 SMA @ 0.903, 50 SMA 0.8978, 100 SMA @ 0.9103 and 200 SMA @ 0.933.
| Trends | Trends.1 | |
|---|---|---|
| 0 | Daily SMA20 | 0.9030 |
| 1 | Daily SMA50 | 0.8978 |
| 2 | Daily SMA100 | 0.9103 |
| 3 | Daily SMA200 | 0.9330 |
The previous day high was 0.8998 while the previous day low was 0.892. The daily 38.2% Fib levels comes at 0.895, expected to provide support. Similarly, the daily 61.8% fib level is at 0.8968, expected to provide resistance.
Note the levels of interest below:
- Pivot support is noted at 0.8901, 0.8871, 0.8822
- Pivot resistance is noted at 0.898, 0.9028, 0.9058
| Levels | Levels.1 |
|---|---|
| Previous Daily High | 0.8998 |
| Previous Daily Low | 0.8920 |
| Previous Weekly High | 0.9109 |
| Previous Weekly Low | 0.8902 |
| Previous Monthly High | 0.9148 |
| Previous Monthly Low | 0.8820 |
| Daily Fibonacci 38.2% | 0.8950 |
| Daily Fibonacci 61.8% | 0.8968 |
| Daily Pivot Point S1 | 0.8901 |
| Daily Pivot Point S2 | 0.8871 |
| Daily Pivot Point S3 | 0.8822 |
| Daily Pivot Point R1 | 0.8980 |
| Daily Pivot Point R2 | 0.9028 |
| Daily Pivot Point R3 | 0.9058 |
[/s2If]
Nehcap Expert Advisor
The NEHCAP MT4 EA is high quality professional trading system geared to generate returns without using GRID or martingales. Each trade has strict risk per trade parameter. The pairs under management include EURUSD, GBPUSD, AUDCAD, AUDNZD,GBPAUD, EURAUD, EURCAD, CHFJPY and many more.
The system is trading live: LIVE ACCOUNT TRACKING
You can run it free. Apply for a free trial and track our account. Buy the system or use profit share mechanism to generate returns on your MT4.
Join Our Telegram Group
")


