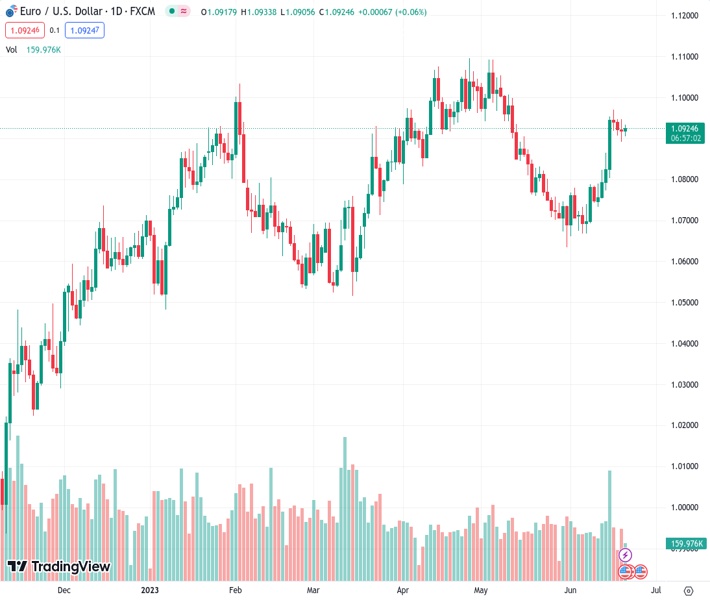
The price action of EURUSD at the level of 1.09250 remains ambiguous without a clear indication of direction.
…
This is a premium post.
[s2If !current_user_can(access_s2member_level4)]Please register for FREE REGISTER to read full post below containing analysis. In case of any error or you think you are not able to read the full post below, please email us at support#nehcap.com [lwa][/s2If] [s2If current_user_can(access_s2member_level1)]
- EUR/USD keeps the inconclusive price action well in place.
The pair currently trades last at 1.09250.
The previous day high was 1.0946 while the previous day low was 1.0893. The daily 38.2% Fib levels comes at 1.0913, expected to provide support. Similarly, the daily 61.8% fib level is at 1.0926, expected to provide resistance.
EUR/USD keeps the range bound theme in place above 1.0900 on Wednesday.
Despite the current inconclusive price action, further gains remain well on the table for the time being. That said, the pair needs to surpass the monthly high at 1.0970 (June 16) ideally in the very near term to allow for a potential test of the psychological 1.1000 mark.
The inability to advance in a convincing fashion in the next sessions could spark a corrective move to, initially, the 55-day SMA at 1.0881 prior to the 100-day SMA at 1.0806. The loss of the latter should alleviate the pair’s upside pressure.
Looking at the longer run, the constructive view remains unchanged while above the 200-day SMA, today at 1.0554.
Technical Levels: Supports and Resistances
EURUSD currently trading at 1.0914 at the time of writing. Pair opened at 1.0918 and is trading with a change of -0.04 % .
| Overview | Overview.1 | |
|---|---|---|
| 0 | Today last price | 1.0914 |
| 1 | Today Daily Change | 28.0000 |
| 2 | Today Daily Change % | -0.0400 |
| 3 | Today daily open | 1.0918 |
The pair remains strongly bullish on the daily timeframe. It trades above its 20 SMA @ 1.0777, 50 SMA 1.088, 100 SMA @ 1.0808 and 200 SMA @ 1.0551.
| Trends | Trends.1 | |
|---|---|---|
| 0 | Daily SMA20 | 1.0777 |
| 1 | Daily SMA50 | 1.0880 |
| 2 | Daily SMA100 | 1.0808 |
| 3 | Daily SMA200 | 1.0551 |
The previous day high was 1.0946 while the previous day low was 1.0893. The daily 38.2% Fib levels comes at 1.0913, expected to provide support. Similarly, the daily 61.8% fib level is at 1.0926, expected to provide resistance.
Note the levels of interest below:
- Pivot support is noted at 1.0892, 1.0865, 1.0838
- Pivot resistance is noted at 1.0945, 1.0972, 1.0999
| Levels | Levels.1 |
|---|---|
| Previous Daily High | 1.0946 |
| Previous Daily Low | 1.0893 |
| Previous Weekly High | 1.0971 |
| Previous Weekly Low | 1.0733 |
| Previous Monthly High | 1.1092 |
| Previous Monthly Low | 1.0635 |
| Daily Fibonacci 38.2% | 1.0913 |
| Daily Fibonacci 61.8% | 1.0926 |
| Daily Pivot Point S1 | 1.0892 |
| Daily Pivot Point S2 | 1.0865 |
| Daily Pivot Point S3 | 1.0838 |
| Daily Pivot Point R1 | 1.0945 |
| Daily Pivot Point R2 | 1.0972 |
| Daily Pivot Point R3 | 1.0999 |
[/s2If]
Nehcap Expert Advisor
The NEHCAP MT4 EA is high quality professional trading system geared to generate returns without using GRID or martingales. Each trade has strict risk per trade parameter. The pairs under management include EURUSD, GBPUSD, AUDCAD, AUDNZD,GBPAUD, EURAUD, EURCAD, CHFJPY and many more.
The system is trading live: LIVE ACCOUNT TRACKING
You can run it free. Apply for a free trial and track our account. Buy the system or use profit share mechanism to generate returns on your MT4.
Join Our Telegram Group
")


