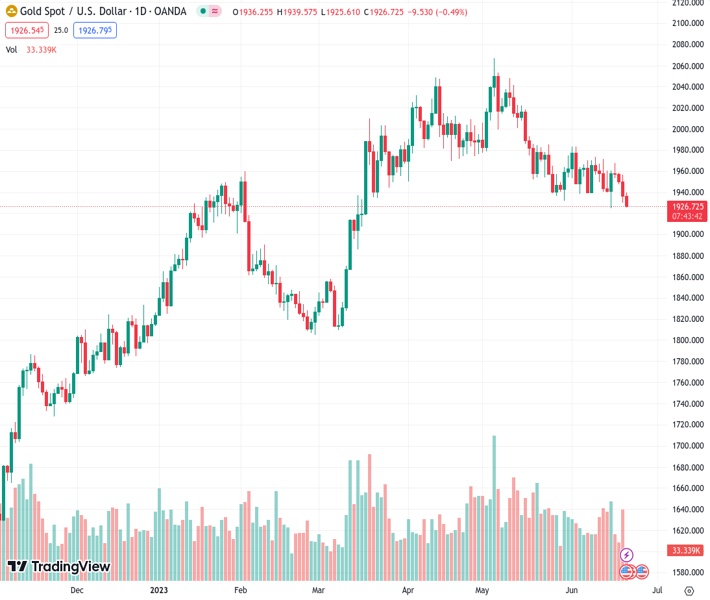
The price of gold, valued at $1,926.94, is experiencing fluctuating increases near $1,930.00 due to the testimony of Fed Powell in Congress.
…
This is a premium post.
[s2If !current_user_can(access_s2member_level4)]Please register for FREE REGISTER to read full post below containing analysis. In case of any error or you think you are not able to read the full post below, please email us at support#nehcap.com [lwa][/s2If] [s2If current_user_can(access_s2member_level1)]
- Gold price is showing volatile spikes around $1,930.00 amid Fed Powell’s testimony at Congress.
The pair currently trades last at 1926.94.
The previous day high was 1956.86 while the previous day low was 1929.82. The daily 38.2% Fib levels comes at 1940.15, expected to provide resistance. Similarly, the daily 61.8% fib level is at 1946.53, expected to provide resistance.
Gold price (XAU/USD) is showing extremely volatile action around $1,930.00 as Federal Reserve (Fed) chair Jerome Powell has sounded hawkish while delivering testimony in front of Congress. The precious metal is strongly defending the $1,930.00 despite Fed Powell having confirmed more rate hikes this year.
S&P500 futures have extended losses further as investors are hoping that expectations of more interest rate hikes from the Federal Reserve (Fed) have pushed the United States economy toward recession. The US Dollar Index (DXY) is showing volatile spikes but is still inside the woods around 102.60. The 10-year US Treasury yields seem choppy around 3.75%.
Fed Powell has confirmed that policymakers are in favor of further interest rate hikes this year as the process of getting inflation back down to 2% has a long way to go. The Fed believes that tight credit conditions are expected to put pressure on economic activities, inflation, and labor market conditions, however, the extent remains uncertain.
Chances of a recession in the United States economy are well solid as more interest rates by the Fed would impact the scales of manufacturing and service activities significantly.
Jerome Powell has confirmed that the central bank will be data-dependent and long-term consumer inflation expectations are well-anchored.
Gold price is on the edge of the horizontal support of the Descending Triangle chart pattern formed on a two-hour scale, which is placed from May 30 low at $1,932.12. The downward-sloping trendline of the aforementioned chart pattern is plotted from June 02 high at $1,983.00. The 200-period Exponential Moving Average (EMA) at $1,958.84 is acting as a barricade for the Gold bulls. Horizontal resistance is plotted from May 05 low around $2,000.00.
The Relative Strength Index (RSI) (14) has slipped into the bearish range of 20.00-40.00, which indicates that the downside momentum has been triggered.
Technical Levels: Supports and Resistances
XAUUSD currently trading at 1929.89 at the time of writing. Pair opened at 1936.4 and is trading with a change of -0.34 % .
| Overview | Overview.1 | |
|---|---|---|
| 0 | Today last price | 1929.89 |
| 1 | Today Daily Change | -6.51 |
| 2 | Today Daily Change % | -0.34 |
| 3 | Today daily open | 1936.40 |
The pair is trading below its 20 Daily moving average @ 1953.76, below its 50 Daily moving average @ 1983.15 , below its 100 Daily moving average @ 1942.45 and above its 200 Daily moving average @ 1849.86
| Trends | Trends.1 | |
|---|---|---|
| 0 | Daily SMA20 | 1953.76 |
| 1 | Daily SMA50 | 1983.15 |
| 2 | Daily SMA100 | 1942.45 |
| 3 | Daily SMA200 | 1849.86 |
The previous day high was 1956.86 while the previous day low was 1929.82. The daily 38.2% Fib levels comes at 1940.15, expected to provide resistance. Similarly, the daily 61.8% fib level is at 1946.53, expected to provide resistance.
Note the levels of interest below:
- Pivot support is noted at 1925.19, 1913.99, 1898.15
- Pivot resistance is noted at 1952.23, 1968.07, 1979.27
| Levels | Levels.1 |
|---|---|
| Previous Daily High | 1956.86 |
| Previous Daily Low | 1929.82 |
| Previous Weekly High | 1971.01 |
| Previous Weekly Low | 1924.85 |
| Previous Monthly High | 2079.76 |
| Previous Monthly Low | 1932.12 |
| Daily Fibonacci 38.2% | 1940.15 |
| Daily Fibonacci 61.8% | 1946.53 |
| Daily Pivot Point S1 | 1925.19 |
| Daily Pivot Point S2 | 1913.99 |
| Daily Pivot Point S3 | 1898.15 |
| Daily Pivot Point R1 | 1952.23 |
| Daily Pivot Point R2 | 1968.07 |
| Daily Pivot Point R3 | 1979.27 |
[/s2If]
Nehcap Expert Advisor
The NEHCAP MT4 EA is high quality professional trading system geared to generate returns without using GRID or martingales. Each trade has strict risk per trade parameter. The pairs under management include EURUSD, GBPUSD, AUDCAD, AUDNZD,GBPAUD, EURAUD, EURCAD, CHFJPY and many more.
The system is trading live: LIVE ACCOUNT TRACKING
You can run it free. Apply for a free trial and track our account. Buy the system or use profit share mechanism to generate returns on your MT4.
Join Our Telegram Group
")


