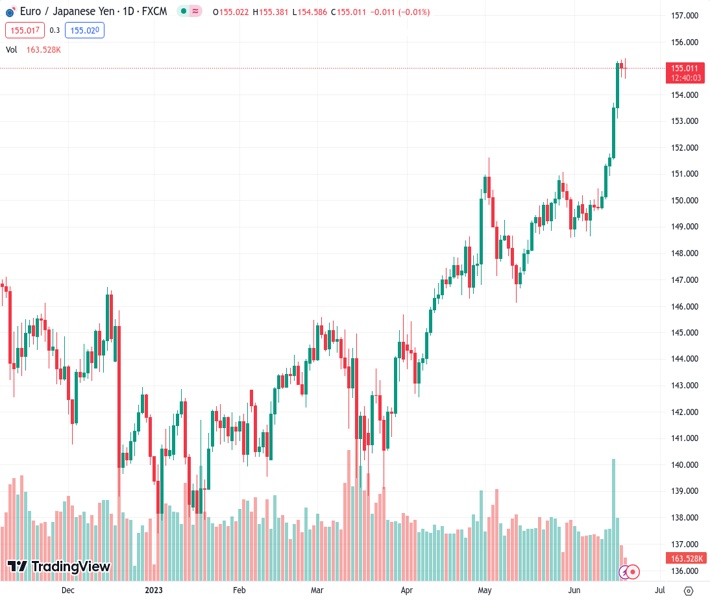
The EURJPY at 155.042 is currently consolidating its recent notable increase, which has taken it to its highest level since September 2008.
…
This is a premium post.
[s2If !current_user_can(access_s2member_level4)]Please register for FREE REGISTER to read full post below containing analysis. In case of any error or you think you are not able to read the full post below, please email us at support#nehcap.com [lwa][/s2If] [s2If current_user_can(access_s2member_level1)]
- EUR/JPY is seen consolidating its recent strong gains to the highest level since September 2008.
The pair currently trades last at 155.042.
The previous day high was 155.33 while the previous day low was 154.65. The daily 38.2% Fib levels comes at 154.91, expected to provide support. Similarly, the daily 61.8% fib level is at 155.07, expected to provide resistance.
The EUR/JPY cross extends its consolidative price move for the second straight day and seesaws between tepid gains/minor losses through the early part of the European session. Spot price currently trades around the 155.00 mark, just below the highest level since September 2008 touched this Tuesday.
A big divergence in the monetary policy stance adopted by the Bank of Japan (BoJ) and the European Central Bank (ECB) is seen as a key factor acting as a tailwind for the EUR/JPY cross. Even from a technical perspective, last week’s sustained breakout through the 151.00 strong horizontal resistance was seen as a fresh trigger for bullish traders. This, in turn, supports prospects for a further near-term appreciating move.
That said, a generally weaker tone around the equity markets lends some support to the safe-haven Japanese Yen (JPY) and caps the upside for the EUR/JPY cross. Moreover, the Relative Strength Index (RSI) on the daily chart is holding well above the 70 mark, flashing overbought conditions and holding back traders from placing fresh bullish bets, though any meaningful corrective pullback still seems elusive.
Hence, a slide back towards the daily swing low, around the 154.60-154.55 area could be seen as a buying opportunity and remain limited. That said, a sustained break below might prompt some technical selling and accelerate the slide towards the 154.00 round-figure mark. The EUR/JPY cross could eventually drop to the 153.65-153.55 region, which should act as a strong base and a pivotal point for short-term traders.
On the flip side, bulls might now wait for a move beyond the 155.35-155.40 zone, or the multi-year peak, before positioning for any further gains. The EUR/JPY cross might then accelerate the momentum towards the 156.00 round figure en route to the next relevant hurdle near the 156.30-156.40 region. Spot prices might then aim to reclaim the 157.00 mark, though overbought RSI warrants some caution for aggressive bullish traders.
Technical Levels: Supports and Resistances
EURJPY currently trading at 155.06 at the time of writing. Pair opened at 155.2 and is trading with a change of -0.09 % .
| Overview | Overview.1 | |
|---|---|---|
| 0 | Today last price | 155.06 |
| 1 | Today Daily Change | -0.14 |
| 2 | Today Daily Change % | -0.09 |
| 3 | Today daily open | 155.20 |
The pair remains strongly bullish on the daily timeframe. It trades above its 20 SMA @ 150.71, 50 SMA 149.11, 100 SMA @ 146.03 and 200 SMA @ 144.55.
| Trends | Trends.1 | |
|---|---|---|
| 0 | Daily SMA20 | 150.71 |
| 1 | Daily SMA50 | 149.11 |
| 2 | Daily SMA100 | 146.03 |
| 3 | Daily SMA200 | 144.55 |
The previous day high was 155.33 while the previous day low was 154.65. The daily 38.2% Fib levels comes at 154.91, expected to provide support. Similarly, the daily 61.8% fib level is at 155.07, expected to provide resistance.
Note the levels of interest below:
- Pivot support is noted at 154.79, 154.38, 154.11
- Pivot resistance is noted at 155.47, 155.74, 156.14
| Levels | Levels.1 |
|---|---|
| Previous Daily High | 155.33 |
| Previous Daily Low | 154.65 |
| Previous Weekly High | 155.27 |
| Previous Weekly Low | 149.67 |
| Previous Monthly High | 151.62 |
| Previous Monthly Low | 146.14 |
| Daily Fibonacci 38.2% | 154.91 |
| Daily Fibonacci 61.8% | 155.07 |
| Daily Pivot Point S1 | 154.79 |
| Daily Pivot Point S2 | 154.38 |
| Daily Pivot Point S3 | 154.11 |
| Daily Pivot Point R1 | 155.47 |
| Daily Pivot Point R2 | 155.74 |
| Daily Pivot Point R3 | 156.14 |
[/s2If]
Nehcap Expert Advisor
The NEHCAP MT4 EA is high quality professional trading system geared to generate returns without using GRID or martingales. Each trade has strict risk per trade parameter. The pairs under management include EURUSD, GBPUSD, AUDCAD, AUDNZD,GBPAUD, EURAUD, EURCAD, CHFJPY and many more.
The system is trading live: LIVE ACCOUNT TRACKING
You can run it free. Apply for a free trial and track our account. Buy the system or use profit share mechanism to generate returns on your MT4.
Join Our Telegram Group
")


