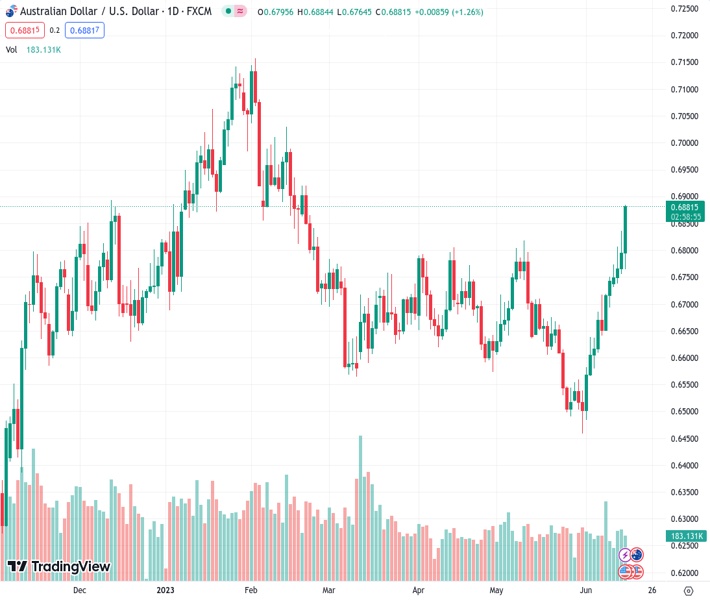
The AUDUSD has experienced six consecutive days of increases, with a rise to the 0.6870 zone from the current level of 0.68821.
…
This is a premium post.
[s2If !current_user_can(access_s2member_level4)]Please register for FREE REGISTER to read full post below containing analysis. In case of any error or you think you are not able to read the full post below, please email us at support#nehcap.com [lwa][/s2If] [s2If current_user_can(access_s2member_level1)]
- AUD/USD sets a sixth consecutive day of gains, jumping to the 0.6870 area.
The pair currently trades last at 0.68821.
The previous day high was 0.6836 while the previous day low was 0.6756. The daily 38.2% Fib levels comes at 0.6805, expected to provide support. Similarly, the daily 61.8% fib level is at 0.6786, expected to provide support.
On Thursday, the AUD/USD pair surged to its highest level since February, gaining 90 pips. In that sense, post the release of US Retail Sales and Jobless Claims data, falling US bond yields and a positive market sentiment weakened the US Dollar and favoured the AUD.
The latest data from the US Census Bureau revealed a surprising expansion in Retail Sales, surpassing expectations as they increased by 0.3% MoM in May, defying the anticipated contraction of 0.1%. Furthermore, Jobless Claims for the week ending June 9 rose to 262,000, slightly higher than the forecasted 249,000 and the same as the previous week’s reading of 262,000.
In Wednesday’s session, the Fed decided to hold rates steady in order to assess additional information regarding its implication on monetary policy. In addition, Fed Chair Powell, in the press conference, stated that the labour market remains robust and drives the US economy, so weakness in this area makes investors think that the Fed may take a more dovish stance for its next meetings.
Reacting to the data, US bond yields are seeing losses across the curve. The 10-year bond yield slid to 3.75% while the 2-year yield stood at 4.68% and the 5-year yields at 3.95%, with all three seeing declines of between 0.30-1%, applying further pressure to the US Dollar. Stocks, on the other hand, continued to trade strong, with the S&P 500 (SPX) gaining over 0.40%, signalling a positive market environment.
Technically speaking, the AUD/USD maintains a clear bullish outlook for the short term, as the pair managed to rally above the 20,100 and 200-day Simple Moving Averages (SMA) and the technical indicators suggest that the buyers have the upperhand. However, the pair approaches overbought conditions, suggesting that a downward correction may be on the horizon.
In case the AUD/USD continues to gain traction, the following resistance line up at the daily high at 0.6875, followed by the psychological mark at 0.6900 and the 0.6950 area. On the other hand, to the downside, the next support levels to watch are the 100-day Simple Moving Average (SMA) at 0.6730, followed by the 200-day and 20-day SMA at 0.6690 and 0.6630, respectively.
Technical Levels: Supports and Resistances
AUDUSD currently trading at 0.6875 at the time of writing. Pair opened at 0.6796 and is trading with a change of 1.16 % .
| Overview | Overview.1 | |
|---|---|---|
| 0 | Today last price | 0.6875 |
| 1 | Today Daily Change | 0.0079 |
| 2 | Today Daily Change % | 1.1600 |
| 3 | Today daily open | 0.6796 |
The pair remains strongly bullish on the daily timeframe. It trades above its 20 SMA @ 0.6627, 50 SMA 0.6664, 100 SMA @ 0.6732 and 200 SMA @ 0.6691.
| Trends | Trends.1 | |
|---|---|---|
| 0 | Daily SMA20 | 0.6627 |
| 1 | Daily SMA50 | 0.6664 |
| 2 | Daily SMA100 | 0.6732 |
| 3 | Daily SMA200 | 0.6691 |
The previous day high was 0.6836 while the previous day low was 0.6756. The daily 38.2% Fib levels comes at 0.6805, expected to provide support. Similarly, the daily 61.8% fib level is at 0.6786, expected to provide support.
Note the levels of interest below:
- Pivot support is noted at 0.6756, 0.6716, 0.6676
- Pivot resistance is noted at 0.6836, 0.6875, 0.6915
| Levels | Levels.1 |
|---|---|
| Previous Daily High | 0.6836 |
| Previous Daily Low | 0.6756 |
| Previous Weekly High | 0.6751 |
| Previous Weekly Low | 0.6579 |
| Previous Monthly High | 0.6818 |
| Previous Monthly Low | 0.6458 |
| Daily Fibonacci 38.2% | 0.6805 |
| Daily Fibonacci 61.8% | 0.6786 |
| Daily Pivot Point S1 | 0.6756 |
| Daily Pivot Point S2 | 0.6716 |
| Daily Pivot Point S3 | 0.6676 |
| Daily Pivot Point R1 | 0.6836 |
| Daily Pivot Point R2 | 0.6875 |
| Daily Pivot Point R3 | 0.6915 |
[/s2If]
Nehcap Expert Advisor
The NEHCAP MT4 EA is high quality professional trading system geared to generate returns without using GRID or martingales. Each trade has strict risk per trade parameter. The pairs under management include EURUSD, GBPUSD, AUDCAD, AUDNZD,GBPAUD, EURAUD, EURCAD, CHFJPY and many more.
The system is trading live: LIVE ACCOUNT TRACKING
You can run it free. Apply for a free trial and track our account. Buy the system or use profit share mechanism to generate returns on your MT4.
Join Our Telegram Group


