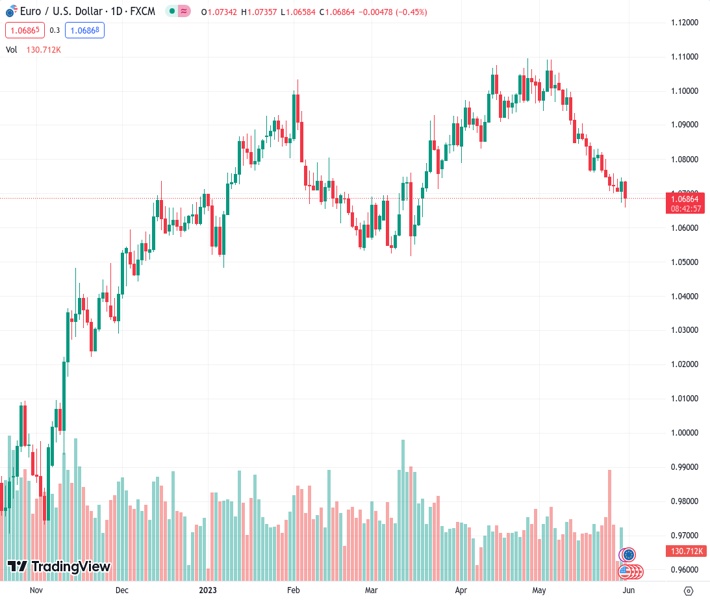
#EURUSD @ 1.06868 slips back to the 1.0660 region, or multi-week lows. (Pivot Orderbook analysis)
…
This is a premium post.
[s2If !current_user_can(access_s2member_level4)]Please register for FREE REGISTER to read full post below containing analysis. In case of any error or you think you are not able to read the full post below, please email us at support#nehcap.com [lwa][/s2If] [s2If current_user_can(access_s2member_level1)]
- EUR/USD slips back to the 1.0660 region, or multi-week lows.
- Further losses below 1.0600 exposes the March low.
The pair currently trades last at 1.06868.
The previous day high was 1.0747 while the previous day low was 1.0672. The daily 38.2% Fib levels comes at 1.0718, expected to provide resistance. Similarly, the daily 61.8% fib level is at 1.0701, expected to provide resistance.
EUR/USD quickly leaves behind Tuesday’s decent advance and resumes the downtrend on Wednesday.
The pair remains under heavy pressure and a breach of the May low at 1.0658 (May 31) could open the door to a test of the round level at 1.0600 prior to the March low at 1.0516 (March 15).
A deeper pullback to the 2023 low at 1.0481 (January 6) would likely need a sharp deterioration of the outlook, which appears not favoured for the time being.
Looking at the longer run, the constructive view remains unchanged while above the 200-day SMA, today at 1.0492.
Technical Levels: Supports and Resistances
EURUSD currently trading at 1.068 at the time of writing. Pair opened at 1.0734 and is trading with a change of -0.5 % .
| Overview | Overview.1 | |
|---|---|---|
| 0 | Today last price | 1.0680 |
| 1 | Today Daily Change | 77.0000 |
| 2 | Today Daily Change % | -0.5000 |
| 3 | Today daily open | 1.0734 |
The pair is trading below its 20 Daily moving average @ 1.0859, below its 50 Daily moving average @ 1.0903 , below its 100 Daily moving average @ 1.0816 and above its 200 Daily moving average @ 1.049
| Trends | Trends.1 | |
|---|---|---|
| 0 | Daily SMA20 | 1.0859 |
| 1 | Daily SMA50 | 1.0903 |
| 2 | Daily SMA100 | 1.0816 |
| 3 | Daily SMA200 | 1.0490 |
The previous day high was 1.0747 while the previous day low was 1.0672. The daily 38.2% Fib levels comes at 1.0718, expected to provide resistance. Similarly, the daily 61.8% fib level is at 1.0701, expected to provide resistance.
Note the levels of interest below:
- Pivot support is noted at 1.0689, 1.0644, 1.0615
- Pivot resistance is noted at 1.0763, 1.0792, 1.0837
| Levels | Levels.1 |
|---|---|
| Previous Daily High | 1.0747 |
| Previous Daily Low | 1.0672 |
| Previous Weekly High | 1.0831 |
| Previous Weekly Low | 1.0702 |
| Previous Monthly High | 1.1095 |
| Previous Monthly Low | 1.0788 |
| Daily Fibonacci 38.2% | 1.0718 |
| Daily Fibonacci 61.8% | 1.0701 |
| Daily Pivot Point S1 | 1.0689 |
| Daily Pivot Point S2 | 1.0644 |
| Daily Pivot Point S3 | 1.0615 |
| Daily Pivot Point R1 | 1.0763 |
| Daily Pivot Point R2 | 1.0792 |
| Daily Pivot Point R3 | 1.0837 |
[/s2If]
Nehcap Expert Advisor
The NEHCAP MT4 EA is high quality professional trading system geared to generate returns without using GRID or martingales. Each trade has strict risk per trade parameter. The pairs under management include EURUSD, GBPUSD, AUDCAD, AUDNZD,GBPAUD, EURAUD, EURCAD, CHFJPY and many more.
The system is trading live: LIVE ACCOUNT TRACKING
You can run it free. Apply for a free trial and track our account. Buy the system or use profit share mechanism to generate returns on your MT4.
Join Our Telegram Group
")


