#USDCAD @ 1.36093 pulls back from a nearly one-month high and is pressured by a combination of factors. (Pivot Orderbook analysis)
…
This is a premium post.
[s2If !current_user_can(access_s2member_level4)]Please register for FREE REGISTER to read full post below containing analysis. In case of any error or you think you are not able to read the full post below, please email us at support#nehcap.com [lwa][/s2If] [s2If current_user_can(access_s2member_level1)]
- USD/CAD pulls back from a nearly one-month high and is pressured by a combination of factors.
- A pickup in Oil prices undermines the Loonie and weighs on the pair amid a modest USD slide.
- Hawkish Fed expectations should help limit the downside ahead of the US Core PCE Price Index.
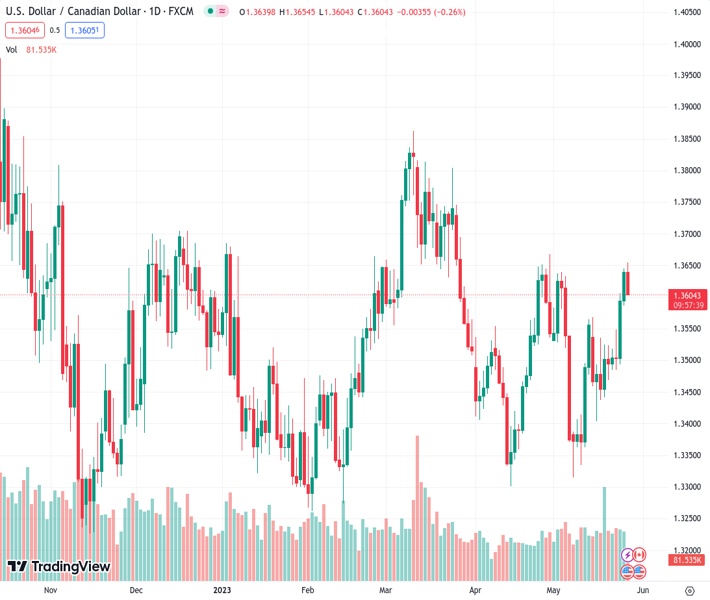
The pair currently trades last at 1.36093.
The previous day high was 1.3645 while the previous day low was 1.3586. The daily 38.2% Fib levels comes at 1.3623, expected to provide resistance. Similarly, the daily 61.8% fib level is at 1.3609, expected to provide support.
The USD/CAD pair retreats from a nearly one-month high, around the 1.3655 region touched earlier this Friday and remains on the defensive through the mid-European session. The pair languishes near the lower of the daily trading range and is pressured by a combination of factors, though manages to hold its neck above the 1.3600 round-figure mark.
Crude Oil prices gain some positive traction and recover a part of the previous day’s slump, which, in turn, is seen underpinning the commodity-linked Loonie. The US Dollar (USD), on the other hand, pulls back from over a two-month high set on Thursday amid a modest downtick in the US Treasury bond yields and further contributes to a mildly offered tone surrounding the USD/CAD pair. That said, the uncertainty over OPEC’s plans for future production cuts, along with worries that a global economic slowdown will dent fuel demand, keep a lid on any meaningful upside for Oil prices.
Apart from this, expectations that the Federal Reserve (Fed) will keep interest rates higher for longer favour the USD bulls and should help limit the downside for the USD/CAD pair, at least for the time being. In fact, the markets started pricing in the possibility of another 25 bps lift-off at the June FOMC meeting following the recent hawkish comments by a slew of US central bank officials. Furthermore, Thursday’s better-than-expected US macro data pointed to a resilient US economy and should allow the Fed to stick to its hawkish stance to combat stubbornly high inflationary pressures.
Hence, the market focus will remain glued to the release of the US Core PCE Price Index – the Fed’s preferred inflation gauge – due later during the early North American session. Friday’s US economic docket also features Durable Goods Orders, which, along with the US bond yields and the US debt ceiling crisis, will drive the USD demand. Apart from this, Oil price dynamics might provide some impetus to the USD/CAD pair. Nevertheless, spot prices remain on track to register strong weekly gains, though bulls might wait for a move beyond the 1.3665-1.3670 area before placing fresh bets.
Technical Levels: Supports and Resistances
USDCAD currently trading at 1.3614 at the time of writing. Pair opened at 1.3641 and is trading with a change of -0.2 % .
| Overview | Overview.1 | |
|---|---|---|
| 0 | Today last price | 1.3614 |
| 1 | Today Daily Change | -0.0027 |
| 2 | Today Daily Change % | -0.2000 |
| 3 | Today daily open | 1.3641 |
The pair remains strongly bullish on the daily timeframe. It trades above its 20 SMA @ 1.3504, 50 SMA 1.3527, 100 SMA @ 1.351 and 200 SMA @ 1.349.
| Trends | Trends.1 | |
|---|---|---|
| 0 | Daily SMA20 | 1.3504 |
| 1 | Daily SMA50 | 1.3527 |
| 2 | Daily SMA100 | 1.3510 |
| 3 | Daily SMA200 | 1.3490 |
The previous day high was 1.3645 while the previous day low was 1.3586. The daily 38.2% Fib levels comes at 1.3623, expected to provide resistance. Similarly, the daily 61.8% fib level is at 1.3609, expected to provide support.
Note the levels of interest below:
- Pivot support is noted at 1.3603, 1.3566, 1.3545
- Pivot resistance is noted at 1.3662, 1.3682, 1.372
| Levels | Levels.1 |
|---|---|
| Previous Daily High | 1.3645 |
| Previous Daily Low | 1.3586 |
| Previous Weekly High | 1.3568 |
| Previous Weekly Low | 1.3404 |
| Previous Monthly High | 1.3668 |
| Previous Monthly Low | 1.3301 |
| Daily Fibonacci 38.2% | 1.3623 |
| Daily Fibonacci 61.8% | 1.3609 |
| Daily Pivot Point S1 | 1.3603 |
| Daily Pivot Point S2 | 1.3566 |
| Daily Pivot Point S3 | 1.3545 |
| Daily Pivot Point R1 | 1.3662 |
| Daily Pivot Point R2 | 1.3682 |
| Daily Pivot Point R3 | 1.3720 |
[/s2If]
Nehcap Expert Advisor
The NEHCAP MT4 EA is high quality professional trading system geared to generate returns without using GRID or martingales. Each trade has strict risk per trade parameter. The pairs under management include EURUSD, GBPUSD, AUDCAD, AUDNZD,GBPAUD, EURAUD, EURCAD, CHFJPY and many more.
The system is trading live: LIVE ACCOUNT TRACKING
You can run it free. Apply for a free trial and track our account. Buy the system or use profit share mechanism to generate returns on your MT4.
Join Our Telegram Group
")


