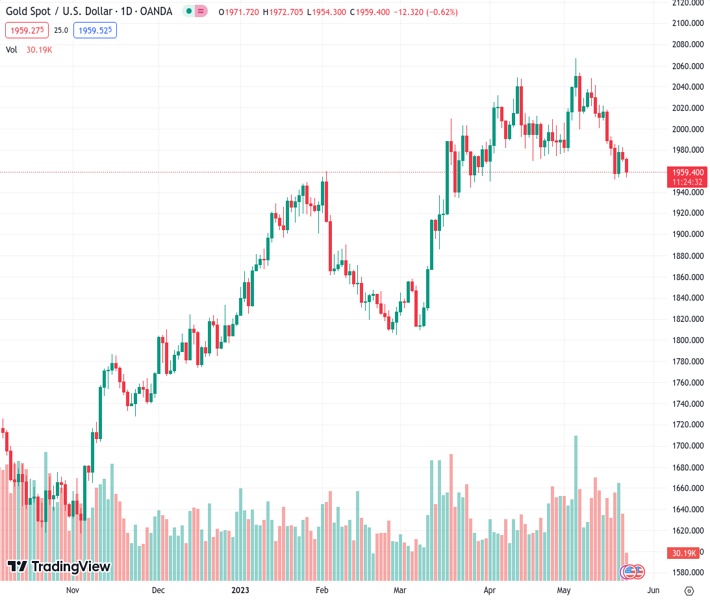
#XAUUSD @ 1,960.01 Gold price drops closer to its lowest level since early April amid modest US Dollar strength. (Pivot Orderbook analysis)
…
This is a premium post.
[s2If !current_user_can(access_s2member_level4)]Please register for FREE REGISTER to read full post below containing analysis. In case of any error or you think you are not able to read the full post below, please email us at support#nehcap.com [lwa][/s2If] [s2If current_user_can(access_s2member_level1)]
- Gold price drops closer to its lowest level since early April amid modest US Dollar strength.
- A combination of factors keeps the US bond yields elevated and underpins the Greenback.
- Looming recession risks could lend support to the safe-haven XAU/USD and help limit losses.
The pair currently trades last at 1960.01.
The previous day high was 1982.63 while the previous day low was 1968.95. The daily 38.2% Fib levels comes at 1974.18, expected to provide resistance. Similarly, the daily 61.8% fib level is at 1977.4, expected to provide resistance.
Gold price remains under some selling pressure for the second successive day on Tuesday and drops back closer to its lowest level since early April during the early European session. The XAU/USD currently trades around the $1,960 area, down over 0.60% for the day, and is pressured by a modest US Dollar (USD) strength.
In fact, the USD Index (DXY), which tracks the Greenback against a basket of currencies, holds steady just below a two-month high touched last week and is seen driving flows away from the US Dollar-denominated Gold price. The overnight hawkish remarks by several Federal Reserve (Fed) officials reaffirmed market expectations that the US central bank will continue hiking interest rates. St. Louis Fed President James Bullard said on Monday that the Fed may still need to raise its benchmark interest rate by another half-point this year. Furthermore, Minneapolis Fed President Neel Kashkari also said it was a close call whether he would vote to raise interest rates or to pause the central bank’s tightening cycle when it meets next month.
Separately, Atlanta Fed President Raphael Bostic said he was comfortable waiting a little bit before deciding on any further moves. Meanwhile, Richmond Fed President Thomas Barkin said he was still looking to be convinced that inflation is in a steady decline. Nevertheless, the outlook lifts bets that the Fed will keep interest rates higher for longer. This, along with hopes that politicians in the United States (US) can come together on a debt ceiling deal and keeps the US Treasury bond yields elevated. In fact, US President Joe Biden and House Speaker Kevin McCarthy ended discussions on Monday with no agreement on how to raise the US government’s $31.4 trillion debt ceiling but will keep talking just 10 days before a possible default.
The optimism, meanwhile, allowed the yield on the benchmark 10-year US government bond to rise for a seventh straight day on Monday and register its longest winning streak since April 2022. This, in turn, lends additional support to the Greenback and further contributes to the offered tone surrounding the non-yielding Gold price. That said, worries over slowing global growth, particularly in China, continue to weigh on investors’ sentiment. It is worth recalling that data from China last week showed that the world’s second-largest economy underperformed in April. Adding to this, mostly disappointing manufacturing PMI prints from the Eurozone further fuel recession fears and could lend some support to the safe-haven XAU/USD, at least for the time being.
Market participants now look forward to the US economic docket, featuring the flash PMI print, New Home Sales data and the Richmond Manufacturing Index, due for release later during the early North American session. This, along with the US debt ceiling talks and the US bond yields, will influence the USD price dynamics and provide some impetus to Gold price. Apart from this, traders will take cues from the broader risk sentiment to grab short-term opportunities around the safe-haven precious metal. Nevertheless, the aforementioned fundamental backdrop seems tilted in favour of bearish traders and supports prospects for a further near-term depreciating move.
From a technical perspective, some follow-through selling below the $1,950 region will be seen as a fresh trigger for bearish traders and expose the 100-day Simple Moving Average (SMA), currently pegged near the $1,931 zone. Failure to defend the said support will make the Gold price vulnerable to accelerate the slide further towards testing the $1,900 round-figure mark.
On the flip side, the ongoing recovery back above the $1,970 horizontal support breakpoint is more likely to attract fresh sellers near the $1,982-$1,984 region. This, in turn, should cap Gold price near the $2,000 psychological mark. That said, a sustained strength beyond could lift the XAU/USD towards the next relevant hurdle near the $2,011-$2,012 region.
Technical Levels: Supports and Resistances
XAUUSD currently trading at 1959.93 at the time of writing. Pair opened at 1971.9 and is trading with a change of -0.61 % .
| Overview | Overview.1 | |
|---|---|---|
| 0 | Today last price | 1959.93 |
| 1 | Today Daily Change | -11.97 |
| 2 | Today Daily Change % | -0.61 |
| 3 | Today daily open | 1971.90 |
The pair is trading below its 20 Daily moving average @ 2003.78, below its 50 Daily moving average @ 1989.73 , above its 100 Daily moving average @ 1930.4 and above its 200 Daily moving average @ 1826.71
| Trends | Trends.1 | |
|---|---|---|
| 0 | Daily SMA20 | 2003.78 |
| 1 | Daily SMA50 | 1989.73 |
| 2 | Daily SMA100 | 1930.40 |
| 3 | Daily SMA200 | 1826.71 |
The previous day high was 1982.63 while the previous day low was 1968.95. The daily 38.2% Fib levels comes at 1974.18, expected to provide resistance. Similarly, the daily 61.8% fib level is at 1977.4, expected to provide resistance.
Note the levels of interest below:
- Pivot support is noted at 1966.36, 1960.81, 1952.68
- Pivot resistance is noted at 1980.04, 1988.17, 1993.72
| Levels | Levels.1 |
|---|---|
| Previous Daily High | 1982.63 |
| Previous Daily Low | 1968.95 |
| Previous Weekly High | 2022.18 |
| Previous Weekly Low | 1952.01 |
| Previous Monthly High | 2048.75 |
| Previous Monthly Low | 1949.83 |
| Daily Fibonacci 38.2% | 1974.18 |
| Daily Fibonacci 61.8% | 1977.40 |
| Daily Pivot Point S1 | 1966.36 |
| Daily Pivot Point S2 | 1960.81 |
| Daily Pivot Point S3 | 1952.68 |
| Daily Pivot Point R1 | 1980.04 |
| Daily Pivot Point R2 | 1988.17 |
| Daily Pivot Point R3 | 1993.72 |
[/s2If]
Nehcap Expert Advisor
The NEHCAP MT4 EA is high quality professional trading system geared to generate returns without using GRID or martingales. Each trade has strict risk per trade parameter. The pairs under management include EURUSD, GBPUSD, AUDCAD, AUDNZD,GBPAUD, EURAUD, EURCAD, CHFJPY and many more.
The system is trading live: LIVE ACCOUNT TRACKING
You can run it free. Apply for a free trial and track our account. Buy the system or use profit share mechanism to generate returns on your MT4.
Join Our Telegram Group
")


