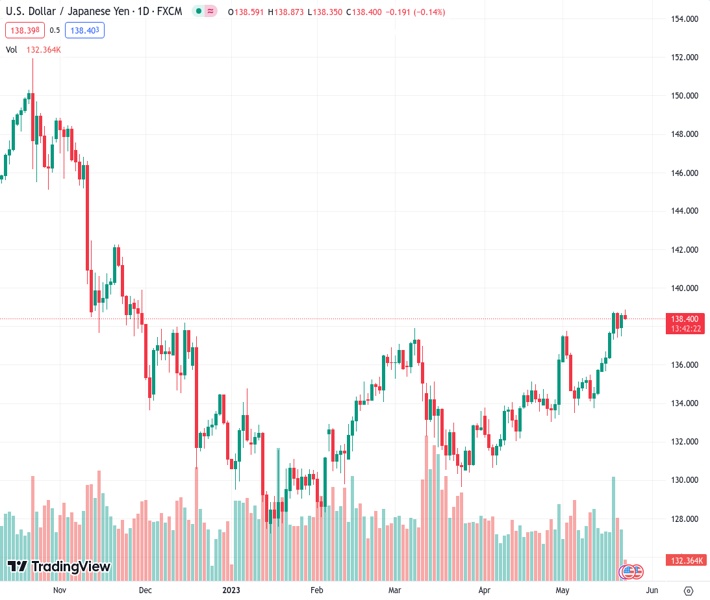
#USDJPY @ 138.537 pulls back after touching a fresh YTD peak on Tuesday, albeit lacks follow-through. (Pivot Orderbook analysis)
…
This is a premium post.
[s2If !current_user_can(access_s2member_level4)]Please register for FREE REGISTER to read full post below containing analysis. In case of any error or you think you are not able to read the full post below, please email us at support#nehcap.com [lwa][/s2If] [s2If current_user_can(access_s2member_level1)]
- USD/JPY pulls back after touching a fresh YTD peak on Tuesday, albeit lacks follow-through.
- Elevated US bond yields continue to underpin the USD and act as a tailwind for the major.
- The Fed-BoJ policy divergence supports prospects for a further near-term appreciating move.
The pair currently trades last at 138.537.
The previous day high was 138.69 while the previous day low was 137.49. The daily 38.2% Fib levels comes at 138.23, expected to provide support. Similarly, the daily 61.8% fib level is at 137.95, expected to provide support.
The USD/JPY pair eases from the vicinity of the 139.00 mark, or a fresh YTD peak touched earlier this Tuesday and remains on the defensive heading into the European session. The pair currently trades with a mild negative bias, around the 138.50-138.45 region, though any meaningful pullback still seems elusive.
The US Dollar (USD) holds steady just below a two-month high touched last Friday amid growing acceptance that the Federal Reserve (Fed) is likely to continue hiking interest rates, which, in turn, should act as a tailwind for the USD/JPY pair. In fact, a slew of influential FOMC members on Monday reaffirmed market bets that the US central bank will keep interest rates higher for longer. This, along with hopes that US politicians can come together on a debt ceiling deal, keeps the US Treasury bond yields elevated and continues to benefit the Greenback.
In fact, the yield on the benchmark 10-year US government bond rose for a seventh day in a row on Monday and registered its longest winning streak since April 2022. The resultant widening of the US-Japan rate differential, along with a more dovish stance adopted by the Bank of Japan (BoJ), undermine the Japanese Yen (JPY) and support prospects for the emergence of some dip-buying around the USD/JPY pair, warranting caution for bearish traders. In fact, BoJ Governor Kazuo Ueda said on Friday the central bank will continue easing with yield curve control.
The aforementioned supportive fundamental backdrop suggests that the path of least resistance for the USD/JPY pair is to the upside. Hence, any subsequent downtick is more likely to get bought into and remain limited ahead of Tuesday’s release of the flash US PMI prints, due later during the early North American session. The US economic docket also features New Home Sales data and the Richmond Manufacturing Index. This, along with the US bond yields and the US debt ceiling talks, should influence the USD price dynamics and provide some impetus to the pair.
Technical Levels: Supports and Resistances
USDJPY currently trading at 138.43 at the time of writing. Pair opened at 138.6 and is trading with a change of -0.12 % .
| Overview | Overview.1 | |
|---|---|---|
| 0 | Today last price | 138.43 |
| 1 | Today Daily Change | -0.17 |
| 2 | Today Daily Change % | -0.12 |
| 3 | Today daily open | 138.60 |
The pair remains strongly bullish on the daily timeframe. It trades above its 20 SMA @ 135.79, 50 SMA 133.97, 100 SMA @ 133.22 and 200 SMA @ 137.15.
| Trends | Trends.1 | |
|---|---|---|
| 0 | Daily SMA20 | 135.79 |
| 1 | Daily SMA50 | 133.97 |
| 2 | Daily SMA100 | 133.22 |
| 3 | Daily SMA200 | 137.15 |
The previous day high was 138.69 while the previous day low was 137.49. The daily 38.2% Fib levels comes at 138.23, expected to provide support. Similarly, the daily 61.8% fib level is at 137.95, expected to provide support.
Note the levels of interest below:
- Pivot support is noted at 137.83, 137.06, 136.64
- Pivot resistance is noted at 139.03, 139.46, 140.22
| Levels | Levels.1 |
|---|---|
| Previous Daily High | 138.69 |
| Previous Daily Low | 137.49 |
| Previous Weekly High | 138.75 |
| Previous Weekly Low | 135.65 |
| Previous Monthly High | 136.56 |
| Previous Monthly Low | 130.63 |
| Daily Fibonacci 38.2% | 138.23 |
| Daily Fibonacci 61.8% | 137.95 |
| Daily Pivot Point S1 | 137.83 |
| Daily Pivot Point S2 | 137.06 |
| Daily Pivot Point S3 | 136.64 |
| Daily Pivot Point R1 | 139.03 |
| Daily Pivot Point R2 | 139.46 |
| Daily Pivot Point R3 | 140.22 |
[/s2If]
Nehcap Expert Advisor
The NEHCAP MT4 EA is high quality professional trading system geared to generate returns without using GRID or martingales. Each trade has strict risk per trade parameter. The pairs under management include EURUSD, GBPUSD, AUDCAD, AUDNZD,GBPAUD, EURAUD, EURCAD, CHFJPY and many more.
The system is trading live: LIVE ACCOUNT TRACKING
You can run it free. Apply for a free trial and track our account. Buy the system or use profit share mechanism to generate returns on your MT4.
Join Our Telegram Group
")


