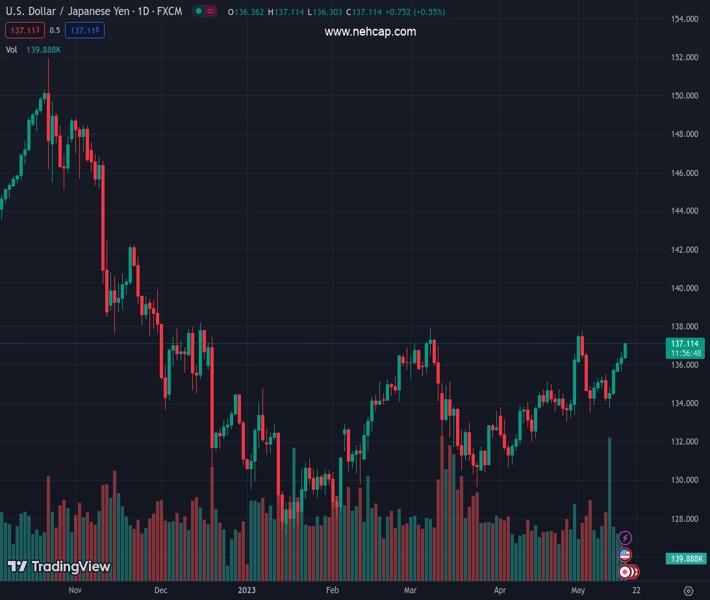
#USDJPY @ 137.048 gains traction for the fifth straight day and climbs to over a two-week high on Wednesday. (Pivot Orderbook analysis)
…
This is a premium post.
[s2If !current_user_can(access_s2member_level4)]Please register for FREE REGISTER to read full post below containing analysis. In case of any error or you think you are not able to read the full post below, please email us at support#nehcap.com [lwa][/s2If] [s2If current_user_can(access_s2member_level1)]
- USD/JPY gains traction for the fifth straight day and climbs to over a two-week high on Wednesday.
- Hawkish Fed expectations push the USD to a nearly two-month top and act as a tailwind for the pair.
- The fundamental backdrop favours bulls and supports prospects for a further appreciating move.
The pair currently trades last at 137.048.
The previous day high was 136.68 while the previous day low was 135.68. The daily 38.2% Fib levels comes at 136.3, expected to provide support. Similarly, the daily 61.8% fib level is at 136.06, expected to provide support.
The USD/JPY pair scales higher for the fifth successive day on Wednesday and climbs to over a two-week high during the early European session. Spot prices currently trade around the 137.00 round-figure mark, which bulls now awaiting a move beyond a technically significant 200-day Simple Moving Average (SMA) before placing fresh bets.
The US Dollar (USD) continues to draw support from the recent hawkish remarks by several Federal Reserve (Fed) officials and climbs to a nearly two-month high, which, in turn, is seen as a key factor acting as a tailwind for the USD/JPY pair. Cleveland Fed President Loretta Mester said on Tuesday that interest rates are not at a sufficiently restrictive level and that the central bank isn’t at the spot to hold rates yet. This, in turn, reaffirms market expectations that the US central bank will keep interest rates higher for longer and provides a goodish lift to the Greenback.
The Japanese Yen (JPY), on the other hand, is weighed down by a more dovish stance adopted by the Bank of Japan (BoJ). It is worth recalling that BoJ Governor Kazuo Ueda said last week that it was too early to discuss specific plans for an exit from the massive stimulus program. This, along with a modest uptick in the US equity futures, undermines the JPY’s safe-haven status and remains supportive of the USD/JPY pair’s ongoing positive move. That said, a modest downtick in the US Treasury bond yields might hold back bulls from placing aggressive bets.
Nevertheless, the aforementioned fundamental backdrop suggests that the path of least resistance for the USD/JPY pair is to the upside. Hence, a subsequent strength back towards retesting the monthly swing high, near the 137.75-137.80 region, looks like a distinct possibility. Some follow-through buying beyond the YTD peak, around the 137.90 area touched in March, will mark a fresh bullish breakout and pave the way for a further appreciating move. Traders now look to the US housing market data – Building Permits and Housing Starts – for a fresh impetus.
Technical Levels: Supports and Resistances
USDJPY currently trading at 136.94 at the time of writing. Pair opened at 136.4 and is trading with a change of 0.4 % .
| Overview | Overview.1 | |
|---|---|---|
| 0 | Today last price | 136.94 |
| 1 | Today Daily Change | 0.54 |
| 2 | Today Daily Change % | 0.40 |
| 3 | Today daily open | 136.40 |
The pair is trading above its 20 Daily moving average @ 135.01, above its 50 Daily moving average @ 133.74 , above its 100 Daily moving average @ 132.98 and below its 200 Daily moving average @ 137.04
| Trends | Trends.1 | |
|---|---|---|
| 0 | Daily SMA20 | 135.01 |
| 1 | Daily SMA50 | 133.74 |
| 2 | Daily SMA100 | 132.98 |
| 3 | Daily SMA200 | 137.04 |
The previous day high was 136.68 while the previous day low was 135.68. The daily 38.2% Fib levels comes at 136.3, expected to provide support. Similarly, the daily 61.8% fib level is at 136.06, expected to provide support.
Note the levels of interest below:
- Pivot support is noted at 135.82, 135.24, 134.81
- Pivot resistance is noted at 136.83, 137.26, 137.84
| Levels | Levels.1 |
|---|---|
| Previous Daily High | 136.68 |
| Previous Daily Low | 135.68 |
| Previous Weekly High | 135.77 |
| Previous Weekly Low | 133.74 |
| Previous Monthly High | 136.56 |
| Previous Monthly Low | 130.63 |
| Daily Fibonacci 38.2% | 136.30 |
| Daily Fibonacci 61.8% | 136.06 |
| Daily Pivot Point S1 | 135.82 |
| Daily Pivot Point S2 | 135.24 |
| Daily Pivot Point S3 | 134.81 |
| Daily Pivot Point R1 | 136.83 |
| Daily Pivot Point R2 | 137.26 |
| Daily Pivot Point R3 | 137.84 |
[/s2If]
Nehcap Expert Advisor
The NEHCAP MT4 EA is high quality professional trading system geared to generate returns without using GRID or martingales. Each trade has strict risk per trade parameter. The pairs under management include EURUSD, GBPUSD, AUDCAD, AUDNZD,GBPAUD, EURAUD, EURCAD, CHFJPY and many more.
The system is trading live: LIVE ACCOUNT TRACKING
You can run it free. Apply for a free trial and track our account. Buy the system or use profit share mechanism to generate returns on your MT4.
Join Our Telegram Group
")


