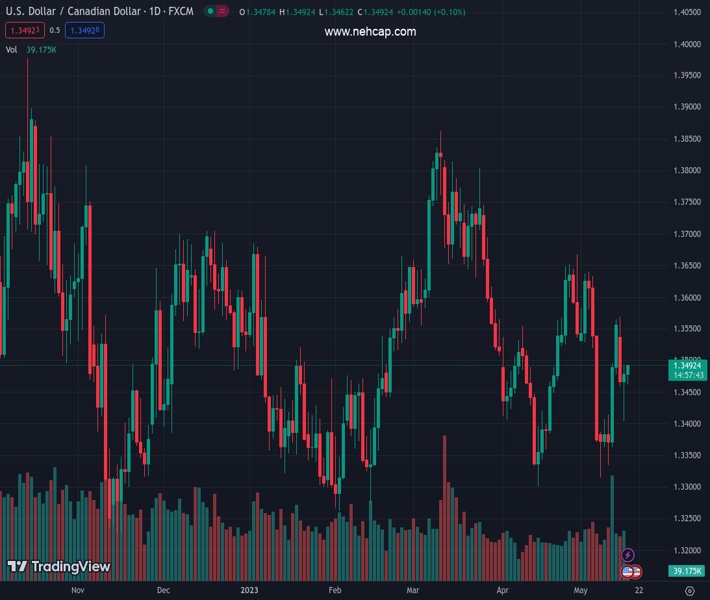
#USDCAD @ 1.34910 is eyeing to reclaim the 1.3500 resistance amid a solid recovery in the USD Index. (Pivot Orderbook analysis)
…
This is a premium post.
[s2If !current_user_can(access_s2member_level4)]Please register for FREE REGISTER to read full post below containing analysis. In case of any error or you think you are not able to read the full post below, please email us at support#nehcap.com [lwa][/s2If] [s2If current_user_can(access_s2member_level1)]
- USD/CAD is eyeing to reclaim the 1.3500 resistance amid a solid recovery in the USD Index.
- The postponement of US debt ceiling issues till the weekend has weighed on US Treasury yields.
- The oil price has dropped sharply as investors are worried about deepening fears of a US recession.
The pair currently trades last at 1.34910.
The previous day high was 1.3494 while the previous day low was 1.3404. The daily 38.2% Fib levels comes at 1.346, expected to provide support. Similarly, the daily 61.8% fib level is at 1.3439, expected to provide support.
The USD/CAD pair is looking to reclaim the psychological resistance of 1.3500 in the early London session. The Loonie asset has rebounded after a mild correction to near 1.3463 amid the recovery move by the US Dollar Index (DXY). The USD Index has refreshed its day’s high at 102.68 as US debt-ceiling issues have deepened further.
S&P500 futures generated moderate gains in the Asian session after a bearish Tuesday. The market mood seems mixed as risk-perceived currencies are facing severe pressure. The postponement of US debt ceiling issues till the weekend has weighed on Treasury yields. The yields offered on 10-year US Treasury bonds have slipped to near 3.52%.
The US Treasury is worried as each passing day is pushing the US economy towards recession. A default in obligated payments by the US Treasury will result in the loss of millions of jobs and Gross Domestic Product (GDP) figures.
On the Canadian Dollar front, a rebound in inflationary figures (April) has renewed fears of further interest rate hikes from the Bank of Canada (BoC). Annual headline Consumer Price Index (CPI) landed at 4.4%, higher than the consensus of 4.1% and the former release of 4.3%. While the core inflation landed between the estimates of 3.9% and the prior release of 4.3% at 4.1%. Also, monthly headline CPI jumped to 0.7% vs. the estimates of 0.4%.
The oil price has dropped sharply as investors are worried about deepening fears of a US recession. Going forward, the oil inventory data by the US Energy Information Administration (EIA) will be keenly watched. It is worth noting that Canada is the leading exporter of oil to the US and lower oil prices impact the Canadian Dollar.
Technical Levels: Supports and Resistances
USDCAD currently trading at 1.3484 at the time of writing. Pair opened at 1.3484 and is trading with a change of 0.0 % .
| Overview | Overview.1 | |
|---|---|---|
| 0 | Today last price | 1.3484 |
| 1 | Today Daily Change | 0.0000 |
| 2 | Today Daily Change % | 0.0000 |
| 3 | Today daily open | 1.3484 |
The pair is trading below its 20 Daily moving average @ 1.3512, below its 50 Daily moving average @ 1.3561 , below its 100 Daily moving average @ 1.3512 and above its 200 Daily moving average @ 1.3467
| Trends | Trends.1 | |
|---|---|---|
| 0 | Daily SMA20 | 1.3512 |
| 1 | Daily SMA50 | 1.3561 |
| 2 | Daily SMA100 | 1.3512 |
| 3 | Daily SMA200 | 1.3467 |
The previous day high was 1.3494 while the previous day low was 1.3404. The daily 38.2% Fib levels comes at 1.346, expected to provide support. Similarly, the daily 61.8% fib level is at 1.3439, expected to provide support.
Note the levels of interest below:
- Pivot support is noted at 1.3428, 1.3371, 1.3338
- Pivot resistance is noted at 1.3517, 1.355, 1.3607
| Levels | Levels.1 |
|---|---|
| Previous Daily High | 1.3494 |
| Previous Daily Low | 1.3404 |
| Previous Weekly High | 1.3565 |
| Previous Weekly Low | 1.3315 |
| Previous Monthly High | 1.3668 |
| Previous Monthly Low | 1.3301 |
| Daily Fibonacci 38.2% | 1.3460 |
| Daily Fibonacci 61.8% | 1.3439 |
| Daily Pivot Point S1 | 1.3428 |
| Daily Pivot Point S2 | 1.3371 |
| Daily Pivot Point S3 | 1.3338 |
| Daily Pivot Point R1 | 1.3517 |
| Daily Pivot Point R2 | 1.3550 |
| Daily Pivot Point R3 | 1.3607 |
[/s2If]
Nehcap Expert Advisor
The NEHCAP MT4 EA is high quality professional trading system geared to generate returns without using GRID or martingales. Each trade has strict risk per trade parameter. The pairs under management include EURUSD, GBPUSD, AUDCAD, AUDNZD,GBPAUD, EURAUD, EURCAD, CHFJPY and many more.
The system is trading live: LIVE ACCOUNT TRACKING
You can run it free. Apply for a free trial and track our account. Buy the system or use profit share mechanism to generate returns on your MT4.
Join Our Telegram Group
")


