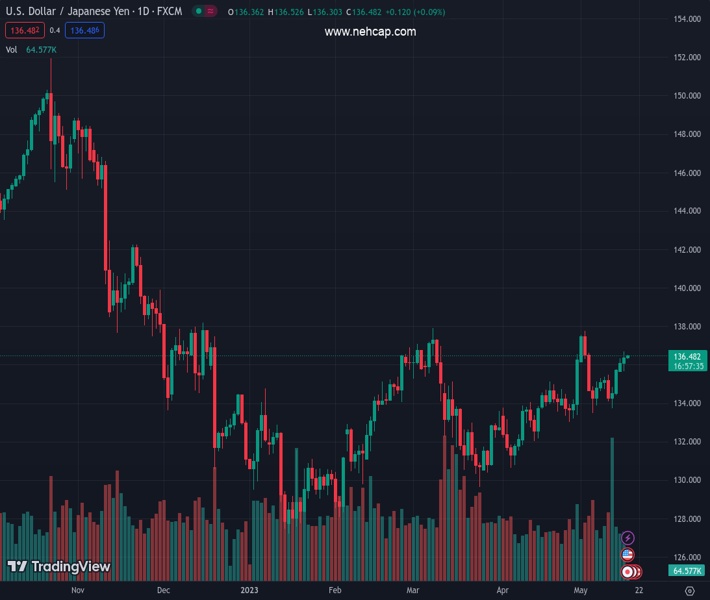
#USDJPY @ 136.457 has climbed above 136.50 as the USD Index is gathering strength for surpassing the immediate resistance of 102.70. (Pivot Orderbook analysis)
…
This is a premium post.
[s2If !current_user_can(access_s2member_level4)]Please register for FREE REGISTER to read full post below containing analysis. In case of any error or you think you are not able to read the full post below, please email us at support#nehcap.com [lwa][/s2If] [s2If current_user_can(access_s2member_level1)]
- USD/JPY has climbed above 136.50 as the USD Index is gathering strength for surpassing the immediate resistance of 102.70.
- Preliminary Japan’s Q1 GDP beat estimates but failed to strengthen the Japanese Yen.
- USD/JPY is marching towards its two-month high resistance plotted at 137.91.
The pair currently trades last at 136.457.
The previous day high was 136.68 while the previous day low was 135.68. The daily 38.2% Fib levels comes at 136.3, expected to provide support. Similarly, the daily 61.8% fib level is at 136.06, expected to provide support.
The USD/JPY pair has resumed its upside journey after a marginal correction below 136.50 in the Asian session. The major is aiming to recapture Tuesday’s high at 136.68 as the Japanese Yen has failed to find strength despite upbeat Q1 Gross Domestic Product (GDP) numbers. Preliminary Q1 GDP accelerated by 0.4% vs. the estimates of 0.1%. In the last quarter, the GDP growth remained stagnant.
The US Dollar Index (DXY) has turned sideways after failing to extend recovery above 102.70 despite the absence of approval for an extension in the US borrowing cap to safeguard the US Treasury from default for obligated payments.
Later this week, Japan’s National Consumer Price Index (CPI) data (April) will be keenly watched. Headline CPI is seen softening to 2.5% from the former release of 3.2%. Also, the core inflation is expected to decelerate to 3.4% against the prior figure of 3.8%.
USD/JPY is marching towards its two-month high resistance plotted from March 08 high at 137.91. The asset is auctioning in an Ascending Triangle chart pattern on a daily scale, which signals a decline in volatility. Upward-sloping trendline from March 24 low at 129.64 will continue to act as a support for the US Dollar bulls.
Advancing 10-period Exponential Moving Average (EMA) at 135.60 indicates strength in USD/JPY.
The Relative Strength Index (RSI) (14) is making efforts for shifting into the bullish range of 60.00-80.00, which will activate the upside momentum.
Should the asset break above Tuesday’s high at 136.68, US Dollar bulls will drive the pair toward March 02 high at 137.10 and a two-month high at 137.91.
On the flip side, a downside move below May 10 high at 135.47 will strengthen the Japanese Yen bulls. This would drag the USD/JPY pair towards May 11 high at 134.84 followed by May 11 low at 133.74.
Technical Levels: Supports and Resistances
USDJPY currently trading at 136.5 at the time of writing. Pair opened at 136.4 and is trading with a change of 0.07 % .
| Overview | Overview.1 | |
|---|---|---|
| 0 | Today last price | 136.50 |
| 1 | Today Daily Change | 0.10 |
| 2 | Today Daily Change % | 0.07 |
| 3 | Today daily open | 136.40 |
The pair is trading above its 20 Daily moving average @ 135.01, above its 50 Daily moving average @ 133.74 , above its 100 Daily moving average @ 132.98 and below its 200 Daily moving average @ 137.04
| Trends | Trends.1 | |
|---|---|---|
| 0 | Daily SMA20 | 135.01 |
| 1 | Daily SMA50 | 133.74 |
| 2 | Daily SMA100 | 132.98 |
| 3 | Daily SMA200 | 137.04 |
The previous day high was 136.68 while the previous day low was 135.68. The daily 38.2% Fib levels comes at 136.3, expected to provide support. Similarly, the daily 61.8% fib level is at 136.06, expected to provide support.
Note the levels of interest below:
- Pivot support is noted at 135.82, 135.24, 134.81
- Pivot resistance is noted at 136.83, 137.26, 137.84
| Levels | Levels.1 |
|---|---|
| Previous Daily High | 136.68 |
| Previous Daily Low | 135.68 |
| Previous Weekly High | 135.77 |
| Previous Weekly Low | 133.74 |
| Previous Monthly High | 136.56 |
| Previous Monthly Low | 130.63 |
| Daily Fibonacci 38.2% | 136.30 |
| Daily Fibonacci 61.8% | 136.06 |
| Daily Pivot Point S1 | 135.82 |
| Daily Pivot Point S2 | 135.24 |
| Daily Pivot Point S3 | 134.81 |
| Daily Pivot Point R1 | 136.83 |
| Daily Pivot Point R2 | 137.26 |
| Daily Pivot Point R3 | 137.84 |
[/s2If]
Nehcap Expert Advisor
The NEHCAP MT4 EA is high quality professional trading system geared to generate returns without using GRID or martingales. Each trade has strict risk per trade parameter. The pairs under management include EURUSD, GBPUSD, AUDCAD, AUDNZD,GBPAUD, EURAUD, EURCAD, CHFJPY and many more.
The system is trading live: LIVE ACCOUNT TRACKING
You can run it free. Apply for a free trial and track our account. Buy the system or use profit share mechanism to generate returns on your MT4.
Join Our Telegram Group


