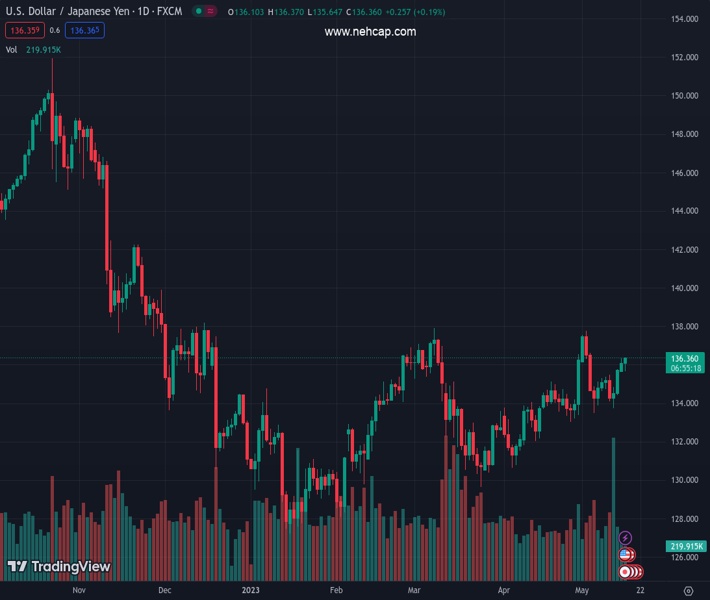
#USDJPY @ 136.289 reverses an intraday dip amid the emergence of some USD dip-buying on Tuesday. (Pivot Orderbook analysis)
…
This is a premium post.
[s2If !current_user_can(access_s2member_level4)]Please register for FREE REGISTER to read full post below containing analysis. In case of any error or you think you are not able to read the full post below, please email us at support#nehcap.com [lwa][/s2If] [s2If current_user_can(access_s2member_level1)]
- USD/JPY reverses an intraday dip amid the emergence of some USD dip-buying on Tuesday.
- Hawkish remarks by Fed’s Mester lift bets for additional rate hikes and boosts the Greenback.
- A softer risk tone could underpin the safe-haven JPY and cap any further gains for the major.
The pair currently trades last at 136.289.
The previous day high was 136.32 while the previous day low was 135.65. The daily 38.2% Fib levels comes at 136.07, expected to provide support. Similarly, the daily 61.8% fib level is at 135.91, expected to provide support.
The USD/JPY pair attracts some dip-buying on Tuesday and move back above the 136.00 mark during the early North American session, closer to a one-and-half-week high touched the previous day.
The US Dollar (USD) recovers its intraday losses in reaction to hawkish remarks by Cleveland Federal Reserve President Loretta Mester and turns out to be a key factor lending support to the USD/JPY pair. Mester said that interest rates are not at a sufficiently restrictive level and that the central bank isn’t at the spot to hold rates yet. This, in turn, triggers a sharp intraday rise in the US Treasury bond yields and acts as a tailwind for the Greenback, overshadowing the mixed US Retail Sales figures.
The US Census Bureau reported that the headline US Retail Sales rose 0.4% MoM in April as compared to consensus estimates for a reading of 0.8%. Meanwhile, sales excluding automobiles registered a modest 0.4% growth during the reported month, as anticipated. The positive surprise came from Retail Sales Control Group, which recorded a solid rebound from the previous month’s 0.4% downfall and increased by 0.7% during the reported month, surpassing market expectations for a flat reading.
This, along with a more dovish stance adopted by the Bank of Japan (BoJ), continues to undermine the Japanese Yen (JPY) and further contributes to the USD/JPY pair’s intraday bounce. It is worth recalling that BoJ Governor Kazuo Ueda said last week that it was too early to discuss specific plans for an exit from the massive stimulus program. That said, a generally weaker toen around the equity markets could benefit the JPY’s relative safe-haven status and cap any meaningful gains for the major.
Against the backdrop of concerns about the US debt ceiling, weaker-than-expected Chinese macro data fuels recession fears and tempers investors’ appetite for riskier assets. Nevertheless, the fundamental backdrop seems tilted in favour of bullish traders and suggests that the path of least resistance for the USD/JPY pair is to the upside. Hence, a subsequent move up towards testing the 200-day Simple Moving Average (SMA), currently around the 137.00 round-figure mark, looks like a distinct possibility.
Technical Levels: Supports and Resistances
USDJPY currently trading at 136.21 at the time of writing. Pair opened at 136.12 and is trading with a change of 0.07 % .
| Overview | Overview.1 | |
|---|---|---|
| 0 | Today last price | 136.21 |
| 1 | Today Daily Change | 0.09 |
| 2 | Today Daily Change % | 0.07 |
| 3 | Today daily open | 136.12 |
The pair is trading above its 20 Daily moving average @ 134.89, above its 50 Daily moving average @ 133.76 , above its 100 Daily moving average @ 132.95 and below its 200 Daily moving average @ 137.04
| Trends | Trends.1 | |
|---|---|---|
| 0 | Daily SMA20 | 134.89 |
| 1 | Daily SMA50 | 133.76 |
| 2 | Daily SMA100 | 132.95 |
| 3 | Daily SMA200 | 137.04 |
The previous day high was 136.32 while the previous day low was 135.65. The daily 38.2% Fib levels comes at 136.07, expected to provide support. Similarly, the daily 61.8% fib level is at 135.91, expected to provide support.
Note the levels of interest below:
- Pivot support is noted at 135.74, 135.36, 135.07
- Pivot resistance is noted at 136.41, 136.7, 137.08
| Levels | Levels.1 |
|---|---|
| Previous Daily High | 136.32 |
| Previous Daily Low | 135.65 |
| Previous Weekly High | 135.77 |
| Previous Weekly Low | 133.74 |
| Previous Monthly High | 136.56 |
| Previous Monthly Low | 130.63 |
| Daily Fibonacci 38.2% | 136.07 |
| Daily Fibonacci 61.8% | 135.91 |
| Daily Pivot Point S1 | 135.74 |
| Daily Pivot Point S2 | 135.36 |
| Daily Pivot Point S3 | 135.07 |
| Daily Pivot Point R1 | 136.41 |
| Daily Pivot Point R2 | 136.70 |
| Daily Pivot Point R3 | 137.08 |
[/s2If]
Nehcap Expert Advisor
The NEHCAP MT4 EA is high quality professional trading system geared to generate returns without using GRID or martingales. Each trade has strict risk per trade parameter. The pairs under management include EURUSD, GBPUSD, AUDCAD, AUDNZD,GBPAUD, EURAUD, EURCAD, CHFJPY and many more.
The system is trading live: LIVE ACCOUNT TRACKING
You can run it free. Apply for a free trial and track our account. Buy the system or use profit share mechanism to generate returns on your MT4.
Join Our Telegram Group


