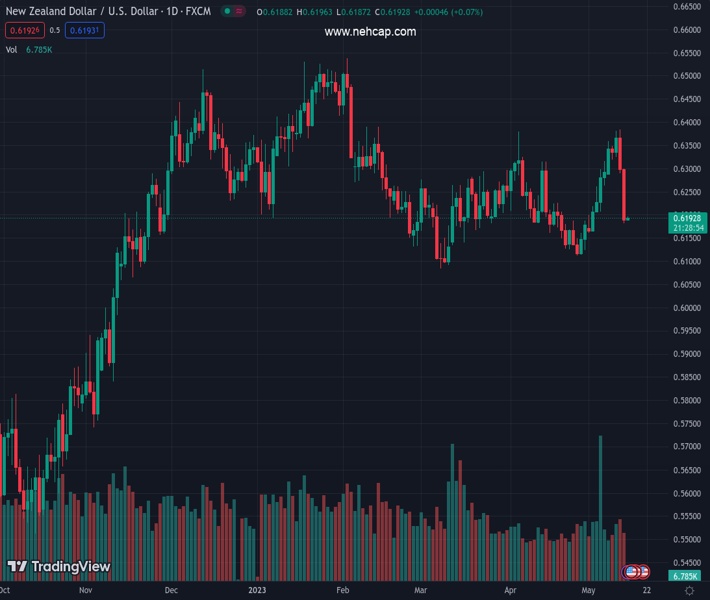
#NZDUSD @ 0.61890 has shifted its auction comfortably below 0.6200 amid negative market sentiment. (Pivot Orderbook analysis)
…
This is a premium post.
[s2If !current_user_can(access_s2member_level4)]Please register for FREE REGISTER to read full post below containing analysis. In case of any error or you think you are not able to read the full post below, please email us at support#nehcap.com [lwa][/s2If] [s2If current_user_can(access_s2member_level1)]
- NZD/USD has shifted its auction comfortably below 0.6200 amid negative market sentiment.
- Consideration of a pause in the rate-hiking spell by other global central banks has provided the Fed a level-field playing.
- NZD/USD has registered a vertical decline and has slipped heavily below the 61.8% Fibo retracement at 0.6216.
The pair currently trades last at 0.61890.
The previous day high was 0.6311 while the previous day low was 0.6182. The daily 38.2% Fib levels comes at 0.6231, expected to provide resistance. Similarly, the daily 61.8% fib level is at 0.6262, expected to provide resistance.
The NZD/USD pair is showing back-and-forth action below the round-level resistance of 0.6200 in the early Tokyo session. Earlier, the Kiwi asset showed a perpendicular downside move as inventors run for the US Dollar Index (DXY) due to growing uncertainty.
The US Dollar Index (DXY) is looking for further gains above 102.73 as other global central banks are also considering a halt in the policy-tightening process to avoid further calamity, which is providing a level field to the safe-haven.
Going forward investors will remain focused on the development of United States debt-ceiling talks, which are expected on Tuesday. Further delay in raising the US borrowing cap will fuel the risk of default in obligated payments by the US Treasury.
NZD/USD has registered a vertical decline and has slipped heavily below the 61.8% Fibonacci retracement (placed from April 26 low at 0.6117 to May 11 high at 0.6385) at 0.6216 on an hourly scale. The 10-period Exponential Moving Average (EMA) at 0.6200 is acting as a barricade for the New Zealand Dollar bulls.
The Relative Strength Index (RSI) (14) is oscillating in the bearish range of 20.00-40.00, signaling further weakness ahead.
Going forward, a breakdown of May 12 low at 0.6182 will further drag the asset toward May’s low at 0.6160 followed by April 26 low at 0.6117.
In an alternate scenario, a recovery move above 61% Fibo retracement at 0.6216 would strengthen the New Zealand Dollar. An occurrence of the same will allow the Kiwi asset to move higher towards 50% and 38.2% Fibo retracements at 0.6248 and 0.6280 respectively.
Technical Levels: Supports and Resistances
NZDUSD currently trading at 0.6193 at the time of writing. Pair opened at 0.6195 and is trading with a change of -0.03 % .
| Overview | Overview.1 | |
|---|---|---|
| 0 | Today last price | 0.6193 |
| 1 | Today Daily Change | -0.0002 |
| 2 | Today Daily Change % | -0.0300 |
| 3 | Today daily open | 0.6195 |
The pair is trading below its 20 Daily moving average @ 0.6217, below its 50 Daily moving average @ 0.622 , below its 100 Daily moving average @ 0.6279 and above its 200 Daily moving average @ 0.6161
| Trends | Trends.1 | |
|---|---|---|
| 0 | Daily SMA20 | 0.6217 |
| 1 | Daily SMA50 | 0.6220 |
| 2 | Daily SMA100 | 0.6279 |
| 3 | Daily SMA200 | 0.6161 |
The previous day high was 0.6311 while the previous day low was 0.6182. The daily 38.2% Fib levels comes at 0.6231, expected to provide resistance. Similarly, the daily 61.8% fib level is at 0.6262, expected to provide resistance.
Note the levels of interest below:
- Pivot support is noted at 0.6148, 0.61, 0.6018
- Pivot resistance is noted at 0.6277, 0.6358, 0.6406
| Levels | Levels.1 |
|---|---|
| Previous Daily High | 0.6311 |
| Previous Daily Low | 0.6182 |
| Previous Weekly High | 0.6385 |
| Previous Weekly Low | 0.6182 |
| Previous Monthly High | 0.6389 |
| Previous Monthly Low | 0.6111 |
| Daily Fibonacci 38.2% | 0.6231 |
| Daily Fibonacci 61.8% | 0.6262 |
| Daily Pivot Point S1 | 0.6148 |
| Daily Pivot Point S2 | 0.6100 |
| Daily Pivot Point S3 | 0.6018 |
| Daily Pivot Point R1 | 0.6277 |
| Daily Pivot Point R2 | 0.6358 |
| Daily Pivot Point R3 | 0.6406 |
[/s2If]
Nehcap Expert Advisor
The NEHCAP MT4 EA is high quality professional trading system geared to generate returns without using GRID or martingales. Each trade has strict risk per trade parameter. The pairs under management include EURUSD, GBPUSD, AUDCAD, AUDNZD,GBPAUD, EURAUD, EURCAD, CHFJPY and many more.
The system is trading live: LIVE ACCOUNT TRACKING
You can run it free. Apply for a free trial and track our account. Buy the system or use profit share mechanism to generate returns on your MT4.
Join Our Telegram Group
")


