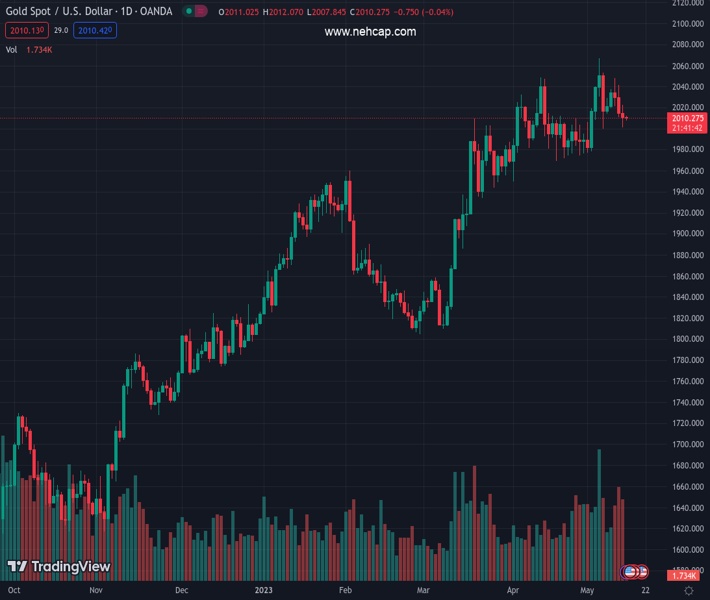
#XAUUSD @ 2,010.48 Gold price is showing signs of a decline in volatility as the focus shifts to US borrowing cap negotiations. (Pivot Orderbook analysis)
…
This is a premium post.
[s2If !current_user_can(access_s2member_level4)]Please register for FREE REGISTER to read full post below containing analysis. In case of any error or you think you are not able to read the full post below, please email us at support#nehcap.com [lwa][/s2If] [s2If current_user_can(access_s2member_level1)]
- Gold price is showing signs of a decline in volatility as the focus shifts to US borrowing cap negotiations.
- Further softening of US CPI and PPI and rise in jobless claims make a fresh proposal for a pause in Fed’s aggressive rate hike spell.
- The overall market mood is negative amid a delay in US debt-ceiling talks.
The pair currently trades last at 2010.48.
The previous day high was 2022.59 while the previous day low was 2000.95. The daily 38.2% Fib levels comes at 2009.22, expected to provide support. Similarly, the daily 61.8% fib level is at 2014.32, expected to provide resistance.
Gold price (XAU/USD) is showing signs of contraction in volatility after a broader recovery to near $2,010.00 in the early Tokyo session. The precious metal is expected to remain on tenterhooks as investors are keenly focusing on the US borrowing cap negotiations between the White House and top Republican leader early this week.
S&P500 ended Friday’s session on a mild bearish note amid a delay in the approval of a higher US Treasury debt-ceiling as negotiations were postponed further. Reuters reported that the Congressional Budget Office warned on Friday that the United States faced a “significant risk” of defaulting on payment obligations within the first two weeks of June without raising the government’s $31.4 trillion debt ceiling, adding that payment operations will remain uncertain throughout May.
Meanwhile, evidence that the Federal Reserve (Fed) will pause its aggressive interest rate hikes regime is rising as after softening of United States inflation, the US Producer Price Index (PPI) report posted the smallest rise in two years, and weekly jobless claims have soared dramatically. However, the US Dollar Index (DXY) has still risen sharply to 102.70 and is eyeing more upside as other global central banks are also approaching a soft landing of their rate-hiking spell to safeguard their economy from further damage.
Gold price is auctioning in a Rising Channel chart pattern on a four-hour scale. The upper portion of the aforementioned chart pattern is plotted from March 20 high at $2,009.88 while the lower portion is placed from March 22 low at $1,934.34.
On a broader note, the 20-period Exponential Moving Average (EMA) at $2,020.00 is overlapping the asset price, indicating a lackluster approach.
The Relative Strength Index (RSI) (14) is oscillating in the 40.00-60.00 range, signaling signs of sideways performance ahead.
Technical Levels: Supports and Resistances
XAUUSD currently trading at 2011.92 at the time of writing. Pair opened at 2010.84 and is trading with a change of 0.05 % .
| Overview | Overview.1 | |
|---|---|---|
| 0 | Today last price | 2011.92 |
| 1 | Today Daily Change | 1.08 |
| 2 | Today Daily Change % | 0.05 |
| 3 | Today daily open | 2010.84 |
The pair remains strongly bullish on the daily timeframe. It trades above its 20 SMA @ 2007.66, 50 SMA 1972.43, 100 SMA @ 1919.95 and 200 SMA @ 1820.95.
| Trends | Trends.1 | |
|---|---|---|
| 0 | Daily SMA20 | 2007.66 |
| 1 | Daily SMA50 | 1972.43 |
| 2 | Daily SMA100 | 1919.95 |
| 3 | Daily SMA200 | 1820.95 |
The previous day high was 2022.59 while the previous day low was 2000.95. The daily 38.2% Fib levels comes at 2009.22, expected to provide support. Similarly, the daily 61.8% fib level is at 2014.32, expected to provide resistance.
Note the levels of interest below:
- Pivot support is noted at 2000.33, 1989.82, 1978.69
- Pivot resistance is noted at 2021.97, 2033.1, 2043.61
| Levels | Levels.1 |
|---|---|
| Previous Daily High | 2022.59 |
| Previous Daily Low | 2000.95 |
| Previous Weekly High | 2048.27 |
| Previous Weekly Low | 2000.95 |
| Previous Monthly High | 2048.75 |
| Previous Monthly Low | 1949.83 |
| Daily Fibonacci 38.2% | 2009.22 |
| Daily Fibonacci 61.8% | 2014.32 |
| Daily Pivot Point S1 | 2000.33 |
| Daily Pivot Point S2 | 1989.82 |
| Daily Pivot Point S3 | 1978.69 |
| Daily Pivot Point R1 | 2021.97 |
| Daily Pivot Point R2 | 2033.10 |
| Daily Pivot Point R3 | 2043.61 |
[/s2If]
Nehcap Expert Advisor
The NEHCAP MT4 EA is high quality professional trading system geared to generate returns without using GRID or martingales. Each trade has strict risk per trade parameter. The pairs under management include EURUSD, GBPUSD, AUDCAD, AUDNZD,GBPAUD, EURAUD, EURCAD, CHFJPY and many more.
The system is trading live: LIVE ACCOUNT TRACKING
You can run it free. Apply for a free trial and track our account. Buy the system or use profit share mechanism to generate returns on your MT4.
Join Our Telegram Group
")


