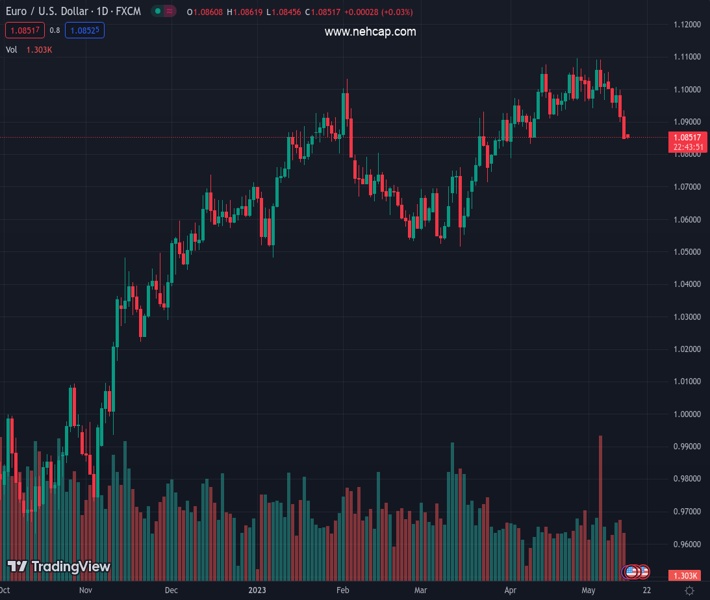
#EURUSD @ 1.08483 steadies at five-week low after posting the biggest weekly loss since September 2022. (Pivot Orderbook analysis)
…
This is a premium post.
[s2If !current_user_can(access_s2member_level4)]Please register for FREE REGISTER to read full post below containing analysis. In case of any error or you think you are not able to read the full post below, please email us at support#nehcap.com [lwa][/s2If] [s2If current_user_can(access_s2member_level1)]
- EUR/USD steadies at five-week low after posting the biggest weekly loss since September 2022.
- Hawkish ECB speak, softer US data fail to impress Euro buyers as US debt ceiling, banking woes underpin US Dollar demand.
- EU Economic Projections, Final readings of inflation and NY Empire State Manufacturing Index eyed for intraday moves.
- US President Joe Biden hints at Tuesday’s debt ceiling talk, Fed Chair Powell’s speech on Friday eyed too.
The pair currently trades last at 1.08483.
The previous day high was 1.0936 while the previous day low was 1.0848. The daily 38.2% Fib levels comes at 1.0881, expected to provide resistance. Similarly, the daily 61.8% fib level is at 1.0902, expected to provide resistance.
EUR/USD seesaws around 1.0850 after losing heavily again the US Dollar in the last week, posting the biggest weekly fall in 8.5 months. In doing so, the Euro pair fails to cheer hawkish European Central Bank (ECB) Officials’ comments, as well as softer US data, amid the greenback’s haven demand, mainly due to the US debt ceiling deadlock.
Recently US President Joe Biden signaled that Friday’s delayed talks will be held on Tuesday, which in turn might have allowed the EUR/USD bears to take a breather. However, the policymakers are still at loggerheads and hence a positive outcome isn’t widely expected, which in turn keeps the Euro pair on the bear’s table.
On Friday, the preliminary readings of the University of Michigan’s (UoM) Consumer Confidence Index for May dropped to 57.7 from 63.5 prior versus 63.0 market forecasts. More interestingly, the one-year inflation expectations dropped from 4.6% to 4.5% for the said month but 5-year counterpart rose to the highest reading since 2011, from 3.0% to 3.2%.
On the other hand, “The latest interest rate hike won’t be the last as it needs to ensure the current wave of inflation comes to an end,” said European Central Bank (ECB) policymaker and Bundesbank Chief Joachim Nagel on Friday while speaking on the sidelines of a Group of Seven (G7) meeting in Japan.
During the weekend, multiple Federal Reserve (Fed) and ECB policymakers spoke on the sidelined of the G7 and the majority of them seem to defend the hawkish play despite suggesting no major rate hike signals.
It’s worth noting that Friday’s postponement of the US policymakers’ meeting on the debt ceiling joined downbeat US data to propel the risk-off mood and propelled the US Dollar. With this, Wall Street closed with losses and the US Treasury bond yields managed to remain firmer, which in turn favored the US Dollar Index (DXY) bulls.
Moving on, the European Commission’s (EC) quarterly economic projections and final readings of April’s Eurozone inflation data, as well as the US NY Empire State Manufacturing Index for May, will be eyed for immediate directions. However, major attention will be given to the US debt ceiling updates for clear directions. Also important will be the Fed talks ahead of US Retail Sales and a speech from Fed Chairman Jerome Powell.
A daily closing below 1.0880 support confluence comprising an 8.5-month-old ascending support line and 50-DMA, now immediate resistance keeps EUR/USD bears hopeful.
Technical Levels: Supports and Resistances
EURUSD currently trading at 1.0854 at the time of writing. Pair opened at 1.0849 and is trading with a change of 0.05% % .
| Overview | Overview.1 | |
|---|---|---|
| 0 | Today last price | 1.0854 |
| 1 | Today Daily Change | 0.0005 |
| 2 | Today Daily Change % | 0.05% |
| 3 | Today daily open | 1.0849 |
The pair is trading below its 20 Daily moving average @ 1.0985, below its 50 Daily moving average @ 1.0871 , above its 100 Daily moving average @ 1.0799 and above its 200 Daily moving average @ 1.0453
| Trends | Trends.1 | |
|---|---|---|
| 0 | Daily SMA20 | 1.0985 |
| 1 | Daily SMA50 | 1.0871 |
| 2 | Daily SMA100 | 1.0799 |
| 3 | Daily SMA200 | 1.0453 |
The previous day high was 1.0936 while the previous day low was 1.0848. The daily 38.2% Fib levels comes at 1.0881, expected to provide resistance. Similarly, the daily 61.8% fib level is at 1.0902, expected to provide resistance.
Note the levels of interest below:
- Pivot support is noted at 1.0819, 1.079, 1.0732
- Pivot resistance is noted at 1.0907, 1.0965, 1.0994
| Levels | Levels.1 |
|---|---|
| Previous Daily High | 1.0936 |
| Previous Daily Low | 1.0848 |
| Previous Weekly High | 1.1054 |
| Previous Weekly Low | 1.0848 |
| Previous Monthly High | 1.1095 |
| Previous Monthly Low | 1.0788 |
| Daily Fibonacci 38.2% | 1.0881 |
| Daily Fibonacci 61.8% | 1.0902 |
| Daily Pivot Point S1 | 1.0819 |
| Daily Pivot Point S2 | 1.0790 |
| Daily Pivot Point S3 | 1.0732 |
| Daily Pivot Point R1 | 1.0907 |
| Daily Pivot Point R2 | 1.0965 |
| Daily Pivot Point R3 | 1.0994 |
[/s2If]
Nehcap Expert Advisor
The NEHCAP MT4 EA is high quality professional trading system geared to generate returns without using GRID or martingales. Each trade has strict risk per trade parameter. The pairs under management include EURUSD, GBPUSD, AUDCAD, AUDNZD,GBPAUD, EURAUD, EURCAD, CHFJPY and many more.
The system is trading live: LIVE ACCOUNT TRACKING
You can run it free. Apply for a free trial and track our account. Buy the system or use profit share mechanism to generate returns on your MT4.
Join Our Telegram Group
")


