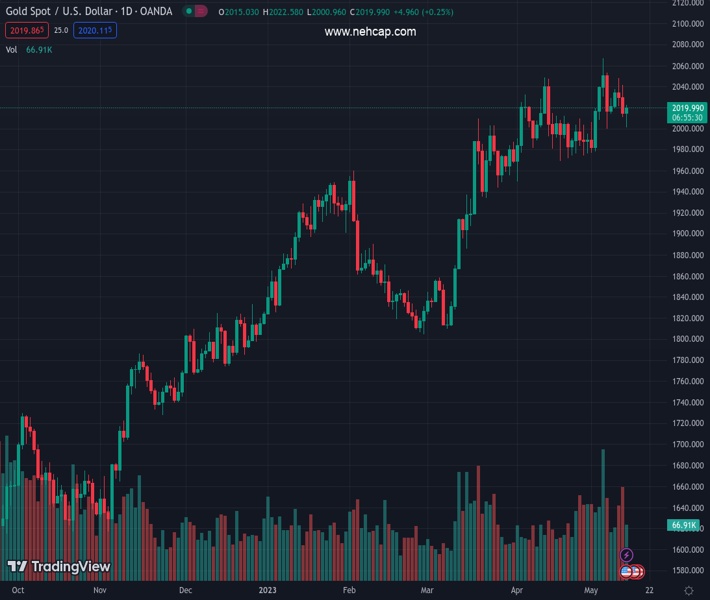
#XAUUSD @ 2,019.60 Gold rebounds despite stronger US Dollar. (Pivot Orderbook analysis)
…
This is a premium post.
[s2If !current_user_can(access_s2member_level4)]Please register for FREE REGISTER to read full post below containing analysis. In case of any error or you think you are not able to read the full post below, please email us at support#nehcap.com [lwa][/s2If] [s2If current_user_can(access_s2member_level1)]
- Gold rebounds despite stronger US Dollar.
- XAU/USD find support above $2,000 and rises erasing daily losses.
The pair currently trades last at 2019.60.
The previous day high was 2041.27 while the previous day low was 2011.19. The daily 38.2% Fib levels comes at 2022.68, expected to provide resistance. Similarly, the daily 61.8% fib level is at 2029.78, expected to provide resistance.
Gold prices rose significantly during the last hour, turning positive for the day. XAU/USD bottomed at $2,000, the lowest level in a week, before quickly rising to the $2,020 zone, where it remains at its daily highs with a bullish sentiment.
The move higher followed the release of the US Import and Export Price Index, which, as expected, showed notable declines from a year ago. These figures will help bring US inflation closer to the Federal Reserve’s target. The next report to be released will be the US Consumer Confidence Index.
The move higher in Gold is taking place even as the US Dollar trades at daily and weekly highs against its main rivals. EUR/USD is below 1.0900, the lowest since mid-April, while AUD/USD holds below 0.6700, at one-week lows.
If XAU/USD continues to rise, the next resistance level is seen at $2,025, followed by the $2,045 area. A retreat below $2,010 would weaken the intraday outlook, exposing the $2,000 mark again.
Gold is headed toward a small weekly gain, the second in a row. The trend is up, but the fact that it is far from the weekly high and from the recent top indicates that the momentum is waning.
Technical Levels: Supports and Resistances
XAUUSD currently trading at 2017.72 at the time of writing. Pair opened at 2015.02 and is trading with a change of 0.13 % .
| Overview | Overview.1 | |
|---|---|---|
| 0 | Today last price | 2017.72 |
| 1 | Today Daily Change | 2.70 |
| 2 | Today Daily Change % | 0.13 |
| 3 | Today daily open | 2015.02 |
The pair remains strongly bullish on the daily timeframe. It trades above its 20 SMA @ 2007.32, 50 SMA 1968.94, 100 SMA @ 1917.77 and 200 SMA @ 1819.85.
| Trends | Trends.1 | |
|---|---|---|
| 0 | Daily SMA20 | 2007.32 |
| 1 | Daily SMA50 | 1968.94 |
| 2 | Daily SMA100 | 1917.77 |
| 3 | Daily SMA200 | 1819.85 |
The previous day high was 2041.27 while the previous day low was 2011.19. The daily 38.2% Fib levels comes at 2022.68, expected to provide resistance. Similarly, the daily 61.8% fib level is at 2029.78, expected to provide resistance.
Note the levels of interest below:
- Pivot support is noted at 2003.72, 1992.41, 1973.64
- Pivot resistance is noted at 2033.8, 2052.57, 2063.88
| Levels | Levels.1 |
|---|---|
| Previous Daily High | 2041.27 |
| Previous Daily Low | 2011.19 |
| Previous Weekly High | 2079.76 |
| Previous Weekly Low | 1977.12 |
| Previous Monthly High | 2048.75 |
| Previous Monthly Low | 1949.83 |
| Daily Fibonacci 38.2% | 2022.68 |
| Daily Fibonacci 61.8% | 2029.78 |
| Daily Pivot Point S1 | 2003.72 |
| Daily Pivot Point S2 | 1992.41 |
| Daily Pivot Point S3 | 1973.64 |
| Daily Pivot Point R1 | 2033.80 |
| Daily Pivot Point R2 | 2052.57 |
| Daily Pivot Point R3 | 2063.88 |
[/s2If]
Nehcap Expert Advisor
The NEHCAP MT4 EA is high quality professional trading system geared to generate returns without using GRID or martingales. Each trade has strict risk per trade parameter. The pairs under management include EURUSD, GBPUSD, AUDCAD, AUDNZD,GBPAUD, EURAUD, EURCAD, CHFJPY and many more.
The system is trading live: LIVE ACCOUNT TRACKING
You can run it free. Apply for a free trial and track our account. Buy the system or use profit share mechanism to generate returns on your MT4.
Join Our Telegram Group
")


