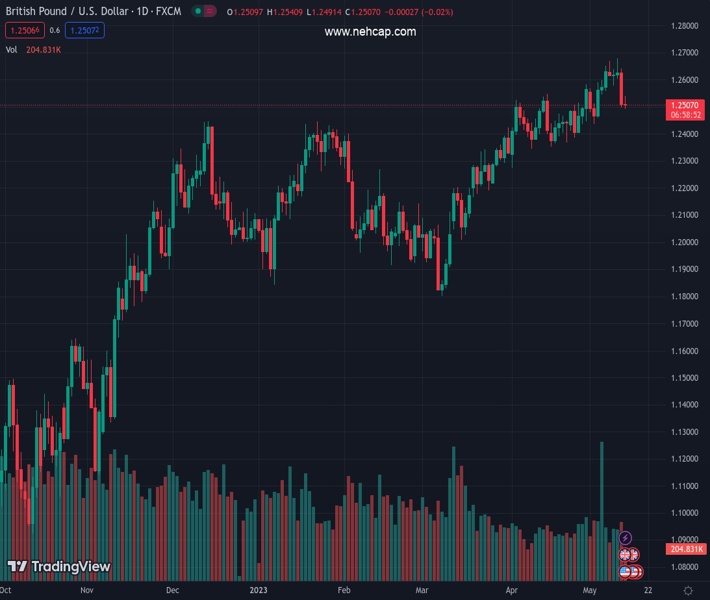
#GBPUSD @ 1.25115 struggles to capitalize on its intraday uptick and meets with a fresh supply on Friday. (Pivot Orderbook analysis)
…
This is a premium post.
[s2If !current_user_can(access_s2member_level4)]Please register for FREE REGISTER to read full post below containing analysis. In case of any error or you think you are not able to read the full post below, please email us at support#nehcap.com [lwa][/s2If] [s2If current_user_can(access_s2member_level1)]
- GBP/USD struggles to capitalize on its intraday uptick and meets with a fresh supply on Friday.
- The BoE’s less hawkish tilt overshadows slightly better UK macro data and undermines the GBP.
- The USD climbs to a nearly two-week high and further exerts downward pressure on the major.
The pair currently trades last at 1.25115.
The previous day high was 1.2641 while the previous day low was 1.2497. The daily 38.2% Fib levels comes at 1.2552, expected to provide resistance. Similarly, the daily 61.8% fib level is at 1.2586, expected to provide resistance.
The GBP/USD pair attracts fresh sellers following an early uptick to the 1.2540 region on Friday and drops to a one-and-half-week low during the early North American session. Spot prices slip below the 1.2500 psychological mark, with bears now awaiting a break below through the lower end of an ascending trend channel extending from the April swing low before placing fresh bets.
The British Pound continues to be undermined by the Bank of England (BoE) Governor Andrew Bailey’s less hawkish comments on Thursday, indicating the possibility of a sharp fall in UK inflation. This, to a larger extent, overshadows mostly in-line UK GDP print for the first quarter of 2023 and the better-than-expected UK Manufacturing/Industrial Production figures for March. Apart from this, some follow-through US Dollar (USD) buying for the second straight day prompts some intraday selling around the GBP/USD pair.
In fact, the USD Index (DXY), which tracks the Greenback against a basket of currencies, hits a one-and-half-week high amid fears about a global economic slowdown. The market worries resurfaced following the mixed release of Chinese inflation figures and the US labor market report on Thursday. That said, concerns about the US debt ceiling, along with a generally positive tone around the equity markets, keeps a lid on any further gains for the safe-haven Greenback and lends support to the GBP/USD pair, at least for now.
The USD bulls also seem reluctant amid the uncertainty over the Federal Reserve’s (Fed) next policy move. In fact, the US CPI report released earlier this week pointed to signs of easing inflationary pressures, which could allow the US central bank to pause its rate-hiking cycle. Investors, however, remain divided over the possibility of rate cuts later this year. This makes it prudent to wait for strong follow-through selling before positioning for an extension of the GBP/USD pair’s pullback from over a one-year high, around the 1.2680 region touched earlier this week.
Technical Levels: Supports and Resistances
GBPUSD currently trading at 1.2501 at the time of writing. Pair opened at 1.2511 and is trading with a change of -0.08 % .
| Overview | Overview.1 | |
|---|---|---|
| 0 | Today last price | 1.2501 |
| 1 | Today Daily Change | -0.0010 |
| 2 | Today Daily Change % | -0.0800 |
| 3 | Today daily open | 1.2511 |
The pair is trading below its 20 Daily moving average @ 1.2504, above its 50 Daily moving average @ 1.2349 , above its 100 Daily moving average @ 1.2245 and above its 200 Daily moving average @ 1.1959
| Trends | Trends.1 | |
|---|---|---|
| 0 | Daily SMA20 | 1.2504 |
| 1 | Daily SMA50 | 1.2349 |
| 2 | Daily SMA100 | 1.2245 |
| 3 | Daily SMA200 | 1.1959 |
The previous day high was 1.2641 while the previous day low was 1.2497. The daily 38.2% Fib levels comes at 1.2552, expected to provide resistance. Similarly, the daily 61.8% fib level is at 1.2586, expected to provide resistance.
Note the levels of interest below:
- Pivot support is noted at 1.2458, 1.2406, 1.2314
- Pivot resistance is noted at 1.2602, 1.2694, 1.2746
| Levels | Levels.1 |
|---|---|
| Previous Daily High | 1.2641 |
| Previous Daily Low | 1.2497 |
| Previous Weekly High | 1.2652 |
| Previous Weekly Low | 1.2436 |
| Previous Monthly High | 1.2584 |
| Previous Monthly Low | 1.2275 |
| Daily Fibonacci 38.2% | 1.2552 |
| Daily Fibonacci 61.8% | 1.2586 |
| Daily Pivot Point S1 | 1.2458 |
| Daily Pivot Point S2 | 1.2406 |
| Daily Pivot Point S3 | 1.2314 |
| Daily Pivot Point R1 | 1.2602 |
| Daily Pivot Point R2 | 1.2694 |
| Daily Pivot Point R3 | 1.2746 |
[/s2If]
Nehcap Expert Advisor
The NEHCAP MT4 EA is high quality professional trading system geared to generate returns without using GRID or martingales. Each trade has strict risk per trade parameter. The pairs under management include EURUSD, GBPUSD, AUDCAD, AUDNZD,GBPAUD, EURAUD, EURCAD, CHFJPY and many more.
The system is trading live: LIVE ACCOUNT TRACKING
You can run it free. Apply for a free trial and track our account. Buy the system or use profit share mechanism to generate returns on your MT4.
Join Our Telegram Group
")


