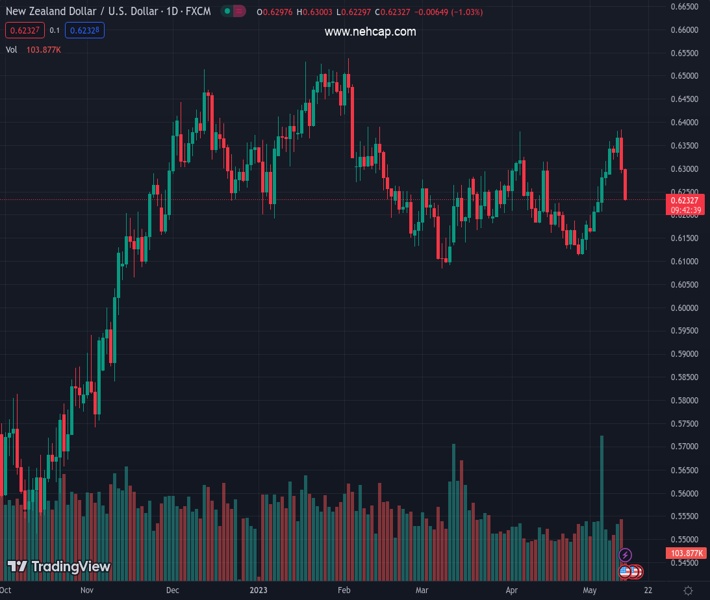
#NZDUSD @ 0.62351 adds to the previous day’s heavy losses and drifts lower for the second straight day. (Pivot Orderbook analysis)
…
This is a premium post.
[s2If !current_user_can(access_s2member_level4)]Please register for FREE REGISTER to read full post below containing analysis. In case of any error or you think you are not able to read the full post below, please email us at support#nehcap.com [lwa][/s2If] [s2If current_user_can(access_s2member_level1)]
- NZD/USD adds to the previous day’s heavy losses and drifts lower for the second straight day.
- Break below the 200-day SMA and the 50% Fibo. level could be seen as a fresh trigger for bears.
- An oversold RSI (14) on the hourly chart warrants caution before positioning for further losses.
The pair currently trades last at 0.62351.
The previous day high was 0.6385 while the previous day low was 0.6289. The daily 38.2% Fib levels comes at 0.6326, expected to provide resistance. Similarly, the daily 61.8% fib level is at 0.6348, expected to provide resistance.
The NZD/USD pair remains under intense selling pressure for the second successive day on Friday and retreats further from a nearly three-month top, around the 0.6380 region touched the previous day. Spot prices continue losing ground through the mid-European session and dive to over a one-week low, around the 0.6230 region in the last hour.
The New Zealand Dollar (NZD) is weighed down heavily by the Reserve Bank of New Zealand’s (RBNZ) survey, which showed that inflation expectations for the first quarter eased to 2.79% from 3.30% in the previous quarter. This, in turn, lessens the need for further rate hikes by the RBNZ and prompts aggressive selling around the NZD/USD pair. Bulls, meanwhile, seem rather unimpressed by subdued US Dollar (USD) price action and a generally positive tone around the equity markets, which tends to benefit the risk-sensitive Kiwi.
From a technical perspective, a convincing break through the very important 200-day Exponential Moving Average (EMA), which coincides with the 50% Fibonacci retracement level of the April-May rally, could be seen as a fresh trigger for bearish traders. Adding to this, oscillators on the daily chart have just started drifting into negative territory and support prospects for a further depreciating move. That said, the Relative Strength (RSI) on the 1-hour chart is flashing extremely oversold conditions and warrants some caution for bears.
Hence, it will be prudent to wait for some intraday consolidation or a modest rebound before traders start positioning for any further depreciating move. Nevertheless, the aforementioned setup suggests that the path of least resistance for the NZD/USD pair is to the downside and any attempted recovery back above the 50% Fibo. level, around mid-0.6200s, might still be seen as a selling opportunity. This, in turn, should cap spot prices near a technically significant 200-day SMA, which should act as a pivotal for short-term traders.
On the flip side, any further downfall could find some support near the 61.8% Fibo. level, around the 0.6215 region. This is closely followed by the 0.6200 mark, below which the NZD/USD pair is likely to accelerate the fall towards the 0.6170-0.6165 intermediate support. Spot prices could drop further to the 0.6135 intermediate support before aiming to challenge the 0.6100 round figure or the April swing low.
Technical Levels: Supports and Resistances
NZDUSD currently trading at 0.6233 at the time of writing. Pair opened at 0.6298 and is trading with a change of -1.03 % .
| Overview | Overview.1 | |
|---|---|---|
| 0 | Today last price | 0.6233 |
| 1 | Today Daily Change | -0.0065 |
| 2 | Today Daily Change % | -1.0300 |
| 3 | Today daily open | 0.6298 |
The pair is trading above its 20 Daily moving average @ 0.6218, above its 50 Daily moving average @ 0.622 , below its 100 Daily moving average @ 0.628 and above its 200 Daily moving average @ 0.6161
| Trends | Trends.1 | |
|---|---|---|
| 0 | Daily SMA20 | 0.6218 |
| 1 | Daily SMA50 | 0.6220 |
| 2 | Daily SMA100 | 0.6280 |
| 3 | Daily SMA200 | 0.6161 |
The previous day high was 0.6385 while the previous day low was 0.6289. The daily 38.2% Fib levels comes at 0.6326, expected to provide resistance. Similarly, the daily 61.8% fib level is at 0.6348, expected to provide resistance.
Note the levels of interest below:
- Pivot support is noted at 0.6263, 0.6228, 0.6167
- Pivot resistance is noted at 0.6359, 0.642, 0.6455
| Levels | Levels.1 |
|---|---|
| Previous Daily High | 0.6385 |
| Previous Daily Low | 0.6289 |
| Previous Weekly High | 0.6316 |
| Previous Weekly Low | 0.6160 |
| Previous Monthly High | 0.6389 |
| Previous Monthly Low | 0.6111 |
| Daily Fibonacci 38.2% | 0.6326 |
| Daily Fibonacci 61.8% | 0.6348 |
| Daily Pivot Point S1 | 0.6263 |
| Daily Pivot Point S2 | 0.6228 |
| Daily Pivot Point S3 | 0.6167 |
| Daily Pivot Point R1 | 0.6359 |
| Daily Pivot Point R2 | 0.6420 |
| Daily Pivot Point R3 | 0.6455 |
[/s2If]
Nehcap Expert Advisor
The NEHCAP MT4 EA is high quality professional trading system geared to generate returns without using GRID or martingales. Each trade has strict risk per trade parameter. The pairs under management include EURUSD, GBPUSD, AUDCAD, AUDNZD,GBPAUD, EURAUD, EURCAD, CHFJPY and many more.
The system is trading live: LIVE ACCOUNT TRACKING
You can run it free. Apply for a free trial and track our account. Buy the system or use profit share mechanism to generate returns on your MT4.
Join Our Telegram Group
")


