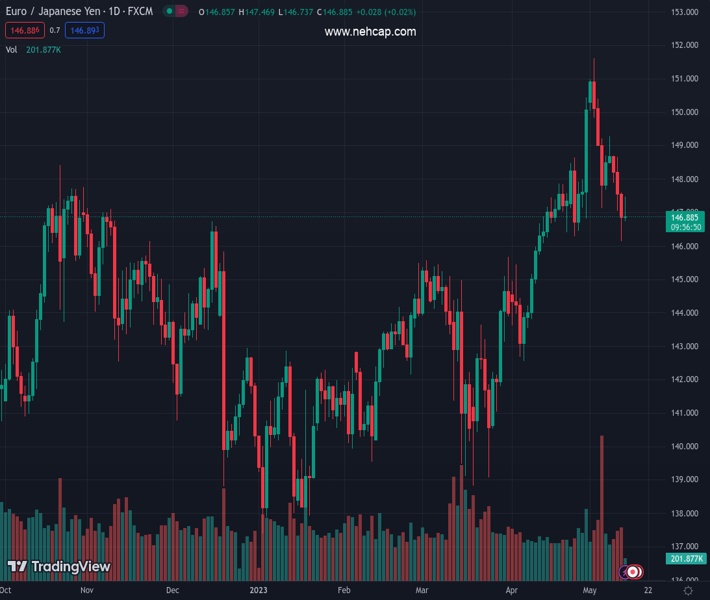
#EURJPY @ 146.878 rebounds from earlier monthly lows near 146.00. (Pivot Orderbook analysis)
…
This is a premium post.
[s2If !current_user_can(access_s2member_level4)]Please register for FREE REGISTER to read full post below containing analysis. In case of any error or you think you are not able to read the full post below, please email us at support#nehcap.com [lwa][/s2If] [s2If current_user_can(access_s2member_level1)]
- EUR/JPY rebounds from earlier monthly lows near 146.00.
- Extra losses should not be ruled out of the time being.
The pair currently trades last at 146.878.
The previous day high was 147.6 while the previous day low was 146.14. The daily 38.2% Fib levels comes at 146.69, expected to provide support. Similarly, the daily 61.8% fib level is at 147.04, expected to provide resistance.
EUR/JPY so far reverses three consecutive daily pullbacks and reclaims the area above the 147.00 mark on Friday.
The monthly leg lower looks unchallenged so far. Against that, the cross could now put the May low of 146.13 (May 11) to the test prior to the provisional 55-day SMA at 145.29.
So far, further upside looks favoured while the cross trades above the 200-day SMA, today at 143.00.
Technical Levels: Supports and Resistances
EURJPY currently trading at 147.01 at the time of writing. Pair opened at 146.87 and is trading with a change of 0.1 % .
| Overview | Overview.1 | |
|---|---|---|
| 0 | Today last price | 147.01 |
| 1 | Today Daily Change | 73.00 |
| 2 | Today Daily Change % | 0.10 |
| 3 | Today daily open | 146.87 |
The pair is trading below its 20 Daily moving average @ 148.08, above its 50 Daily moving average @ 145.35 , above its 100 Daily moving average @ 143.47 and above its 200 Daily moving average @ 142.99
| Trends | Trends.1 | |
|---|---|---|
| 0 | Daily SMA20 | 148.08 |
| 1 | Daily SMA50 | 145.35 |
| 2 | Daily SMA100 | 143.47 |
| 3 | Daily SMA200 | 142.99 |
The previous day high was 147.6 while the previous day low was 146.14. The daily 38.2% Fib levels comes at 146.69, expected to provide support. Similarly, the daily 61.8% fib level is at 147.04, expected to provide resistance.
Note the levels of interest below:
- Pivot support is noted at 146.14, 145.4, 144.68
- Pivot resistance is noted at 147.6, 148.33, 149.07
| Levels | Levels.1 |
|---|---|
| Previous Daily High | 147.60 |
| Previous Daily Low | 146.14 |
| Previous Weekly High | 151.62 |
| Previous Weekly Low | 147.13 |
| Previous Monthly High | 150.44 |
| Previous Monthly Low | 142.55 |
| Daily Fibonacci 38.2% | 146.69 |
| Daily Fibonacci 61.8% | 147.04 |
| Daily Pivot Point S1 | 146.14 |
| Daily Pivot Point S2 | 145.40 |
| Daily Pivot Point S3 | 144.68 |
| Daily Pivot Point R1 | 147.60 |
| Daily Pivot Point R2 | 148.33 |
| Daily Pivot Point R3 | 149.07 |
[/s2If]
Nehcap Expert Advisor
The NEHCAP MT4 EA is high quality professional trading system geared to generate returns without using GRID or martingales. Each trade has strict risk per trade parameter. The pairs under management include EURUSD, GBPUSD, AUDCAD, AUDNZD,GBPAUD, EURAUD, EURCAD, CHFJPY and many more.
The system is trading live: LIVE ACCOUNT TRACKING
You can run it free. Apply for a free trial and track our account. Buy the system or use profit share mechanism to generate returns on your MT4.
Join Our Telegram Group
")


