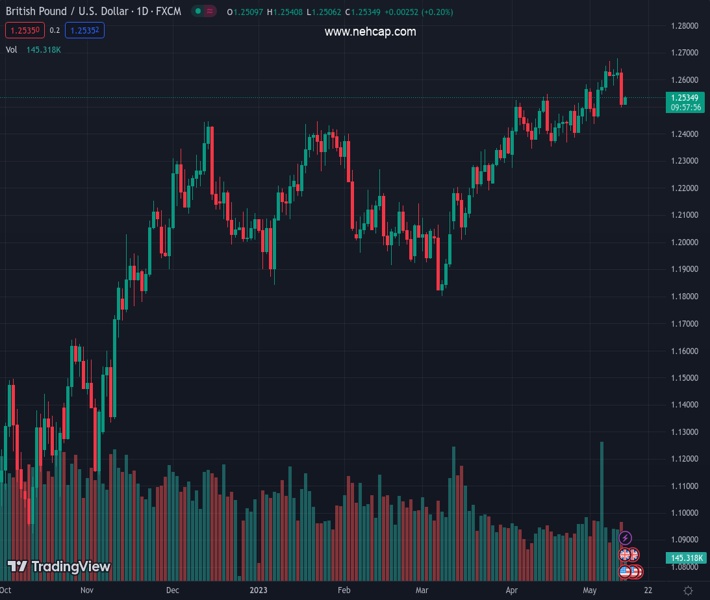
#GBPUSD @ 1.25363 bounce off a one-month-old ascending channel support, though lacks follow-through. (Pivot Orderbook analysis)
…
This is a premium post.
[s2If !current_user_can(access_s2member_level4)]Please register for FREE REGISTER to read full post below containing analysis. In case of any error or you think you are not able to read the full post below, please email us at support#nehcap.com [lwa][/s2If] [s2If current_user_can(access_s2member_level1)]
- GBP/USD bounce off a one-month-old ascending channel support, though lacks follow-through.
- The technical setup warrants some caution before positioning for any further near-term decline.
- A convincing break below the ascending channel support is needed to confirm a bearish break.
The pair currently trades last at 1.25363.
The previous day high was 1.2641 while the previous day low was 1.2497. The daily 38.2% Fib levels comes at 1.2552, expected to provide resistance. Similarly, the daily 61.8% fib level is at 1.2586, expected to provide resistance.
The GBP/USD pair attracts some buying near the 1.2500 psychological mark, which coincides with the lower end of a short-term ascending trend line extending from early April and recovers a part of the previous day’s slump to over a one-week low. The pair sticks to its mildly positive tone, around the 1.2525-1.2530 region through the first half of the European session and for now, seems to have stalled a pullback from its highest level since April 2022 touched on Wednesday.
The US Dollar (USD) struggles to gain any meaningful traction and is seen consolidating the previous day’s strong move up, which, in turn, is seen as a key factor lending some support to the GBP/USD pair. The upside, however, remains capped in the wake of the Bank of England (BoE) Governor Andrew Bailey’s less hawkish remarks on Thursday, indicating the possibility of a sharp fall in UK inflation. This, to a larger extent, overshadows mostly in line UK GDP print for the first quarter of 2023 and the better-than-expected UK Manufacturing/Industrial Production figures for March.
From a technical perspective, the recent failure near the aforementioned trend-channel resistance and the subsequent downfall might have already shifted the near-term bias in favour of bearish traders. That said, oscillators on the daily chart – though have been losing positive traction – are still holding in the bullish territory. This, in turn, makes it prudent to wait for a convincing break below the 1.2500 mark, or the ascending trend-channel support, before positioning for any further depreciating move. The GBP/USD pair might then accelerate the slide towards the 1.2440-1.2435 region.
This is followed by the 1.2400 round figure, below which the downward trajectory could get extended further towards the next relevant support near the 1.2370-1.2465 region en route to the mid-1.2300s. The GBP/USD pair could eventually weaken further below the 1.2300 round-figure mark and test the 1.2275-1.2270 horizontal support.
On the flip side, any subsequent move-up is likely to confront stiff resistance near the 1.2550-1.2560 region. A sustained strength beyond will reaffirm the trend-channel support and trigger a near-term short-covering move. The GBP/USD pair might then aim to reclaim the 1.2600 round figure and test the 1.2635-1.2640 supply zone. The upward trajectory has the potential to push spot prices towards the 1.2700 mark, which coincides with the top end of the ascending channel. The latter should act as a pivotal point, which if cleared will be seen as a fresh trigger for bullish traders.
Technical Levels: Supports and Resistances
GBPUSD currently trading at 1.2527 at the time of writing. Pair opened at 1.2511 and is trading with a change of 0.13 % .
| Overview | Overview.1 | |
|---|---|---|
| 0 | Today last price | 1.2527 |
| 1 | Today Daily Change | 0.0016 |
| 2 | Today Daily Change % | 0.1300 |
| 3 | Today daily open | 1.2511 |
The pair remains strongly bullish on the daily timeframe. It trades above its 20 SMA @ 1.2504, 50 SMA 1.2349, 100 SMA @ 1.2245 and 200 SMA @ 1.1959.
| Trends | Trends.1 | |
|---|---|---|
| 0 | Daily SMA20 | 1.2504 |
| 1 | Daily SMA50 | 1.2349 |
| 2 | Daily SMA100 | 1.2245 |
| 3 | Daily SMA200 | 1.1959 |
The previous day high was 1.2641 while the previous day low was 1.2497. The daily 38.2% Fib levels comes at 1.2552, expected to provide resistance. Similarly, the daily 61.8% fib level is at 1.2586, expected to provide resistance.
Note the levels of interest below:
- Pivot support is noted at 1.2458, 1.2406, 1.2314
- Pivot resistance is noted at 1.2602, 1.2694, 1.2746
| Levels | Levels.1 |
|---|---|
| Previous Daily High | 1.2641 |
| Previous Daily Low | 1.2497 |
| Previous Weekly High | 1.2652 |
| Previous Weekly Low | 1.2436 |
| Previous Monthly High | 1.2584 |
| Previous Monthly Low | 1.2275 |
| Daily Fibonacci 38.2% | 1.2552 |
| Daily Fibonacci 61.8% | 1.2586 |
| Daily Pivot Point S1 | 1.2458 |
| Daily Pivot Point S2 | 1.2406 |
| Daily Pivot Point S3 | 1.2314 |
| Daily Pivot Point R1 | 1.2602 |
| Daily Pivot Point R2 | 1.2694 |
| Daily Pivot Point R3 | 1.2746 |
[/s2If]
Nehcap Expert Advisor
The NEHCAP MT4 EA is high quality professional trading system geared to generate returns without using GRID or martingales. Each trade has strict risk per trade parameter. The pairs under management include EURUSD, GBPUSD, AUDCAD, AUDNZD,GBPAUD, EURAUD, EURCAD, CHFJPY and many more.
The system is trading live: LIVE ACCOUNT TRACKING
You can run it free. Apply for a free trial and track our account. Buy the system or use profit share mechanism to generate returns on your MT4.
Join Our Telegram Group
")


