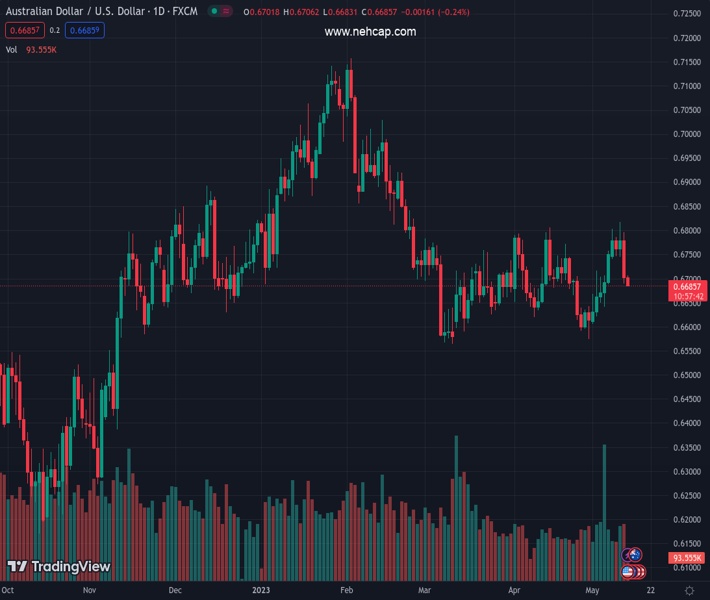
#AUDUSD @ 0.66855 drifts lower for the second successive day and hits a fresh weekly low on Friday. (Pivot Orderbook analysis)
…
This is a premium post.
[s2If !current_user_can(access_s2member_level4)]Please register for FREE REGISTER to read full post below containing analysis. In case of any error or you think you are not able to read the full post below, please email us at support#nehcap.com [lwa][/s2If] [s2If current_user_can(access_s2member_level1)]
- AUD/USD drifts lower for the second successive day and hits a fresh weekly low on Friday.
- Worries about a global economic slowdown drive flow away from the risk-sensitive Aussie.
- A positive risk tone undermines the safe-haven USD and helps limit losses for the major.
The pair currently trades last at 0.66855.
The previous day high was 0.6796 while the previous day low was 0.6689. The daily 38.2% Fib levels comes at 0.673, expected to provide resistance. Similarly, the daily 61.8% fib level is at 0.6755, expected to provide resistance.
The AUD/USD pair adds to the previous day’s heavy losses and remains under some selling pressure for the second successive day on Friday. The pair maintains its offered tone through the first half of the European session and is currently placed just below the 0.6700 mark, with bears flirting with the 50-day Simple Moving Average (SMA).
Concerns about a global economic slowdown resurfaced on Thursday following the release of the mixed Chinese inflation figures and weaker US labor market report, which, in turn, is seen as a key factor weighing on the risk-sensitive Aussie. The US Dollar (USD), on the other hand, is seen consolidating the previous day’s strong gains to over a one-week high and draws some support from a modest uptick in the US Treasury bond yields. This, in turn, exerts additional downward pressure on the AUD/USD pair, though the downside seems limited.
The uncertainty over the Federal Reserve’s (Fed) next policy move is holding back the USD bulls from placing aggressive bets. In fact, the US CPI report released earlier this week pointed to signs of easing inflationary pressure and could allow the US central bank to pause its year-long rate-hiking cycle. Investors, however, remain divided over the possibility of rate cuts later this year. This, along with a generally positive tone around the equity markets, keeps a lid on any further gains for the safe-haven buck and lends support to the AUD/USD pair.
Apart from this, the Reserve Bank of Australia’s (RBA) hawkish outlook, indicating that some further tightening of monetary policy may be required to ensure that inflation returns to target in a reasonable time, warrants caution for bearish traders. Hence, it will be prudent to wait for strong follow-through selling before positioning for an extension of this week’s rejection slide from the 100-day SMA. Nevertheless, the AUD/USD pair remains on track to end the week in the red and reverse a major part of its gains recorded over the past week or so.
Technical Levels: Supports and Resistances
AUDUSD currently trading at 0.6694 at the time of writing. Pair opened at 0.6702 and is trading with a change of -0.12 % .
| Overview | Overview.1 | |
|---|---|---|
| 0 | Today last price | 0.6694 |
| 1 | Today Daily Change | -0.0008 |
| 2 | Today Daily Change % | -0.1200 |
| 3 | Today daily open | 0.6702 |
The pair is trading below its 20 Daily moving average @ 0.6694, above its 50 Daily moving average @ 0.6685 , below its 100 Daily moving average @ 0.6791 and below its 200 Daily moving average @ 0.6725
| Trends | Trends.1 | |
|---|---|---|
| 0 | Daily SMA20 | 0.6694 |
| 1 | Daily SMA50 | 0.6685 |
| 2 | Daily SMA100 | 0.6791 |
| 3 | Daily SMA200 | 0.6725 |
The previous day high was 0.6796 while the previous day low was 0.6689. The daily 38.2% Fib levels comes at 0.673, expected to provide resistance. Similarly, the daily 61.8% fib level is at 0.6755, expected to provide resistance.
Note the levels of interest below:
- Pivot support is noted at 0.6662, 0.6622, 0.6555
- Pivot resistance is noted at 0.6769, 0.6836, 0.6877
| Levels | Levels.1 |
|---|---|
| Previous Daily High | 0.6796 |
| Previous Daily Low | 0.6689 |
| Previous Weekly High | 0.6757 |
| Previous Weekly Low | 0.6607 |
| Previous Monthly High | 0.6806 |
| Previous Monthly Low | 0.6574 |
| Daily Fibonacci 38.2% | 0.6730 |
| Daily Fibonacci 61.8% | 0.6755 |
| Daily Pivot Point S1 | 0.6662 |
| Daily Pivot Point S2 | 0.6622 |
| Daily Pivot Point S3 | 0.6555 |
| Daily Pivot Point R1 | 0.6769 |
| Daily Pivot Point R2 | 0.6836 |
| Daily Pivot Point R3 | 0.6877 |
[/s2If]
Nehcap Expert Advisor
The NEHCAP MT4 EA is high quality professional trading system geared to generate returns without using GRID or martingales. Each trade has strict risk per trade parameter. The pairs under management include EURUSD, GBPUSD, AUDCAD, AUDNZD,GBPAUD, EURAUD, EURCAD, CHFJPY and many more.
The system is trading live: LIVE ACCOUNT TRACKING
You can run it free. Apply for a free trial and track our account. Buy the system or use profit share mechanism to generate returns on your MT4.
Join Our Telegram Group
")


