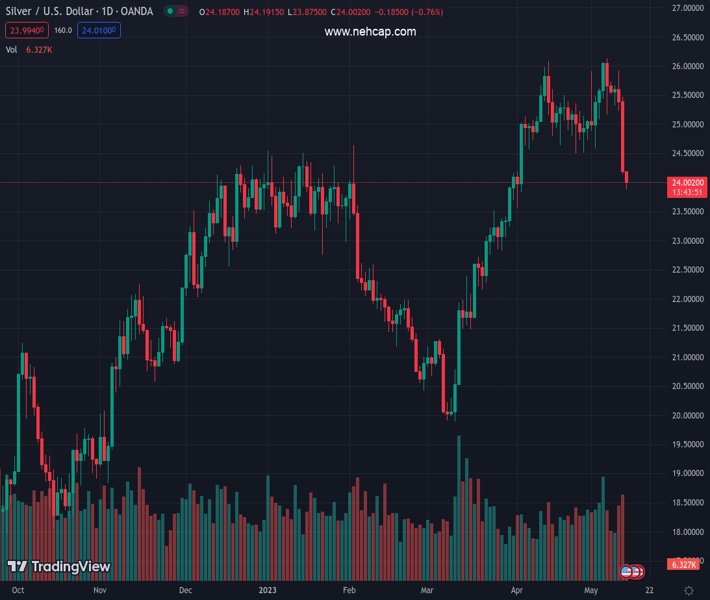
#XAGUSD @ 23.981 Silver drifts lower for the third successive day and hits over a one-month low on Friday. (Pivot Orderbook analysis)
…
This is a premium post.
[s2If !current_user_can(access_s2member_level4)]Please register for FREE REGISTER to read full post below containing analysis. In case of any error or you think you are not able to read the full post below, please email us at support#nehcap.com [lwa][/s2If] [s2If current_user_can(access_s2member_level1)]
- Silver drifts lower for the third successive day and hits over a one-month low on Friday.
- The overnight breakthrough the $24.50-40 horizontal support favours bearish traders.
- Some follow-through selling below the 38.2% Fibo. will set the stage for deeper losses.
The pair currently trades last at 23.981.
The previous day high was 25.48 while the previous day low was 24.14. The daily 38.2% Fib levels comes at 24.65, expected to provide resistance. Similarly, the daily 61.8% fib level is at 24.97, expected to provide resistance.
Silver remains under some selling pressure for the third successive day on Friday and drops to sub-$24.00 levels, or over a one-month low heading into the European session.
From a technical perspective, the recent repeated failures near the $26.00 round-figure mark and the subsequent steep break through the $24.50-$24.40 strong horizontal support favours bearish traders. Moreover, oscillators on the daily chart are holding deep in the negative territory and are still far from being in the oversold zone. This might have already set the stage for a further near-term depreciating move for the XAG/USD.
The white metal, however, manages to find some support near the 50-day Simple Moving Average (SMA). This is followed by the 38.2% Fibonacci retracement level of the March-April rally, around the $23.75-$23.70 area, which if broken will reaffirm the negative bias. The XAG/USD might then test the 100-day SMA, currently pegged near the $23.40-$23.45 area, before eventually dropping to the 50% Fibo. level, around the $23.00 mark.
On the flip side, any meaningful recovery attempt might now confront stiff resistance near the $24.40-$24.40 support breakpoint, which coincides with the 23.6% Fibo. level. A sustained strength beyond could negate the bearish outlook and lift the XAG/USD to the $25.00 psychological mark en route to the $25.55-$25.60 resistance. Bulls might then make a fresh attempt to conquer the $26.00 mark and test the YTD peak, around the $26.10-$26.15 area.
Technical Levels: Supports and Resistances
XAGUSD currently trading at 23.97 at the time of writing. Pair opened at 24.19 and is trading with a change of -0.91 % .
| Overview | Overview.1 | |
|---|---|---|
| 0 | Today last price | 23.97 |
| 1 | Today Daily Change | -0.22 |
| 2 | Today Daily Change % | -0.91 |
| 3 | Today daily open | 24.19 |
The pair is trading below its 20 Daily moving average @ 25.24, above its 50 Daily moving average @ 23.81 , above its 100 Daily moving average @ 23.39 and above its 200 Daily moving average @ 21.83
| Trends | Trends.1 | |
|---|---|---|
| 0 | Daily SMA20 | 25.24 |
| 1 | Daily SMA50 | 23.81 |
| 2 | Daily SMA100 | 23.39 |
| 3 | Daily SMA200 | 21.83 |
The previous day high was 25.48 while the previous day low was 24.14. The daily 38.2% Fib levels comes at 24.65, expected to provide resistance. Similarly, the daily 61.8% fib level is at 24.97, expected to provide resistance.
Note the levels of interest below:
- Pivot support is noted at 23.72, 23.26, 22.39
- Pivot resistance is noted at 25.06, 25.94, 26.4
| Levels | Levels.1 |
|---|---|
| Previous Daily High | 25.48 |
| Previous Daily Low | 24.14 |
| Previous Weekly High | 26.14 |
| Previous Weekly Low | 24.58 |
| Previous Monthly High | 26.09 |
| Previous Monthly Low | 23.57 |
| Daily Fibonacci 38.2% | 24.65 |
| Daily Fibonacci 61.8% | 24.97 |
| Daily Pivot Point S1 | 23.72 |
| Daily Pivot Point S2 | 23.26 |
| Daily Pivot Point S3 | 22.39 |
| Daily Pivot Point R1 | 25.06 |
| Daily Pivot Point R2 | 25.94 |
| Daily Pivot Point R3 | 26.40 |
[/s2If]
Nehcap Expert Advisor
The NEHCAP MT4 EA is high quality professional trading system geared to generate returns without using GRID or martingales. Each trade has strict risk per trade parameter. The pairs under management include EURUSD, GBPUSD, AUDCAD, AUDNZD,GBPAUD, EURAUD, EURCAD, CHFJPY and many more.
The system is trading live: LIVE ACCOUNT TRACKING
You can run it free. Apply for a free trial and track our account. Buy the system or use profit share mechanism to generate returns on your MT4.
Join Our Telegram Group
")


