#XAGUSD @ 25.276 Silver remains on the defensive below the mid-$25.00s, though the downside seems limited. (Pivot Orderbook analysis)
…
This is a premium post.
[s2If !current_user_can(access_s2member_level4)]Please register for FREE REGISTER to read full post below containing analysis. In case of any error or you think you are not able to read the full post below, please email us at support#nehcap.com [lwa][/s2If] [s2If current_user_can(access_s2member_level1)]
- Silver remains on the defensive below the mid-$25.00s, though the downside seems limited.
- The technical setup favours bullish traders and supports prospects for further near-term gains.
- A convincing break below the $25.50-40 strong support is needed to negate the positive bias.
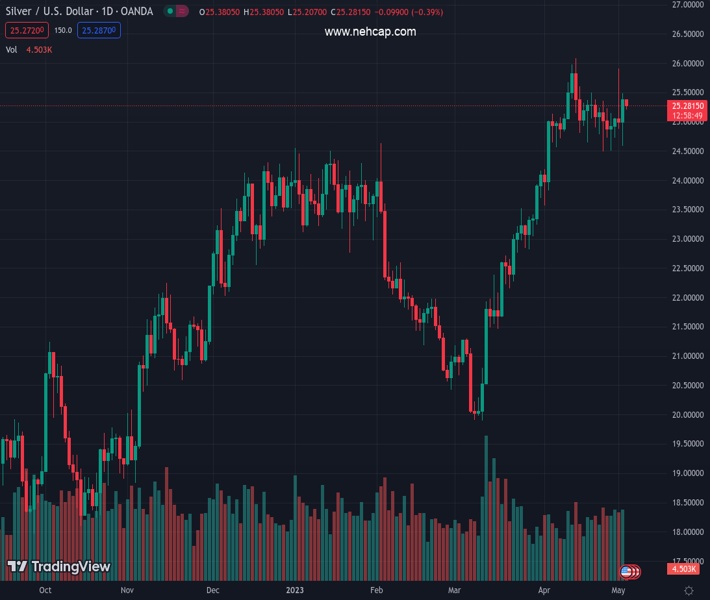
The pair currently trades last at 25.276.
The previous day high was 25.49 while the previous day low was 24.58. The daily 38.2% Fib levels comes at 25.14, expected to provide support. Similarly, the daily 61.8% fib level is at 24.93, expected to provide support.
Silver struggles to capitalize on the previous day’s solid bounce from the vicinity of the $24.50-$24.40 strong horizontal support and edges lower during the first half of trading on Wednesday. The white metal sticks to a mildly negative tone and remains below mid-$25.00s through the early European session, though the downside potential seems limited.
From a technical perspective, the XAG/USD has been showing some resilience near the 23.6% Fibonacci retracement level of the March-April rally and the subsequent rally favours bullish traders. Moreover, positive oscillators on the daily chart, which are still far from being in the overbought zone, support prospects for a further near-term appreciating move.
Some follow-through buying beyond the $25.50-$25.60 supply zone will reaffirm the positive outlook and allow the XAG/USD to make a fresh attempt to conquer the $26.00 round-figure mark. This is closely followed by a one-year high touched in April, above which the white metal could climb to the $26.25-$26.30 region en route to the $27.00 round-figure mark.
On the flip side, the $25.00 psychological mark now seems to protect the immediate downside. Any further fall might still be seen as a buying opportunity and remain limited near the $24.50-$24.40 region. The latter should act as a key pivotal point, which if broken will negate any positive outlook and shift the near-term bias in favour of bearish traders.
The XAG/USD might then weaken further below the $24.00 mark and accelerate the slide towards testing the 38.2% Fibo. level, around the $23.70 area. The corrective decline could get extended further to the next relevant support near the $23.35-$23.30 area before the white metal eventually drops to the $23.00 round-figure mark, representing the 50% Fibo. level.
Technical Levels: Supports and Resistances
XAGUSD currently trading at 25.28 at the time of writing. Pair opened at 25.38 and is trading with a change of -0.39 % .
| Overview | Overview.1 | |
|---|---|---|
| 0 | Today last price | 25.28 |
| 1 | Today Daily Change | -0.10 |
| 2 | Today Daily Change % | -0.39 |
| 3 | Today daily open | 25.38 |
The pair remains strongly bullish on the daily timeframe. It trades above its 20 SMA @ 25.15, 50 SMA 23.21, 100 SMA @ 23.26 and 200 SMA @ 21.63.
| Trends | Trends.1 | |
|---|---|---|
| 0 | Daily SMA20 | 25.15 |
| 1 | Daily SMA50 | 23.21 |
| 2 | Daily SMA100 | 23.26 |
| 3 | Daily SMA200 | 21.63 |
The previous day high was 25.49 while the previous day low was 24.58. The daily 38.2% Fib levels comes at 25.14, expected to provide support. Similarly, the daily 61.8% fib level is at 24.93, expected to provide support.
Note the levels of interest below:
- Pivot support is noted at 24.81, 24.24, 23.9
- Pivot resistance is noted at 25.72, 26.06, 26.62
| Levels | Levels.1 |
|---|---|
| Previous Daily High | 25.49 |
| Previous Daily Low | 24.58 |
| Previous Weekly High | 25.36 |
| Previous Weekly Low | 24.49 |
| Previous Monthly High | 26.09 |
| Previous Monthly Low | 23.57 |
| Daily Fibonacci 38.2% | 25.14 |
| Daily Fibonacci 61.8% | 24.93 |
| Daily Pivot Point S1 | 24.81 |
| Daily Pivot Point S2 | 24.24 |
| Daily Pivot Point S3 | 23.90 |
| Daily Pivot Point R1 | 25.72 |
| Daily Pivot Point R2 | 26.06 |
| Daily Pivot Point R3 | 26.62 |
[/s2If]
Nehcap Expert Advisor
The NEHCAP MT4 EA is high quality professional trading system geared to generate returns without using GRID or martingales. Each trade has strict risk per trade parameter. The pairs under management include EURUSD, GBPUSD, AUDCAD, AUDNZD,GBPAUD, EURAUD, EURCAD, CHFJPY and many more.
The system is trading live: LIVE ACCOUNT TRACKING
You can run it free. Apply for a free trial and track our account. Buy the system or use profit share mechanism to generate returns on your MT4.
Join Our Telegram Group
")


