Investors dumped US technology stocks in anticipation of poor earnings and weak guidance. (Pivot Orderbook analysis)
…
This is a premium post.
[s2If !current_user_can(access_s2member_level4)]Please register for FREE REGISTER to read full post below containing analysis. In case of any error or you think you are not able to read the full post below, please email us at support#nehcap.com [lwa][/s2If] [s2If current_user_can(access_s2member_level1)]
- Investors dumped US technology stocks in anticipation of poor earnings and weak guidance.
- Japanese stocks remained positive as BoJ Ueda reiterates the need for an ultra-dovish monetary policy.
- South Korea’s KOSPI has witnessed an intense sell-off after mixed preliminary GDP data.
The pair currently trades last at 28699.24.
The previous day high was 28727.04 while the previous day low was 28540.42. The daily 38.2% Fib levels comes at 28655.75, expected to provide support. Similarly, the daily 61.8% fib level is at 28611.71, expected to provide support.
Markets in the Asian domain are facing immense selling pressure as a sell-off in United States technology stocks recorded on Monday ahead of their quarterly earnings. This week, investors will remain busy amid quarterly results from Amazon, Google, Meta Platforms, and Microsoft. Investors are worried that the impact of higher interest rates from the Federal Reserve (Fed) will be visible in their corporate earnings and they may also impact the revenue guidance.
S&P500 futures are showing significant losses in the Asian session after a choppy Monday, portraying caution among market participants. The US Dollar Index (DXY) has found an intermediate cushion around 101.20 after a rigorous sell-off. The downside in the USD Index seems favored as investors have digested anticipation of consecutive 25 basis points (bps) interest rate hike from the Federal Reserve (Fed).
At the press time, Japan’s Nikkei 225 gained 0.23%, Shanghai dropped 0.35%, Hang Seng plummeted 1.54%, KOSPI dived 1.78%, and Nifty50 remains flat.
Japanese stocks have hogged the limelight as investors are anticipating a continuation of the expansionary monetary policy stance from Bank of Japan (BoJ) Governor Kazuo Ueda. While speaking in the Japanese parliament on Tuesday, new BoJ Governor Kazuo Ueda said, “Trend inflation remains below 2% but gradually accelerating, which is partly due to the effect of monetary easing.” He further added, “It takes very long for the impact of monetary policy steps to appear on economy, prices.
South Korea’s KOSPI has witnessed an intense sell-off after mixed preliminary Gross Domestic Product (GDP) data. The South Korean economy has grown by 0.3% in the first quarter of CY2023 while the street was anticipating a growth rate of 0.2%. On an annual basis, the GDP has declined to 0.8% from the estimates of 0.9%.
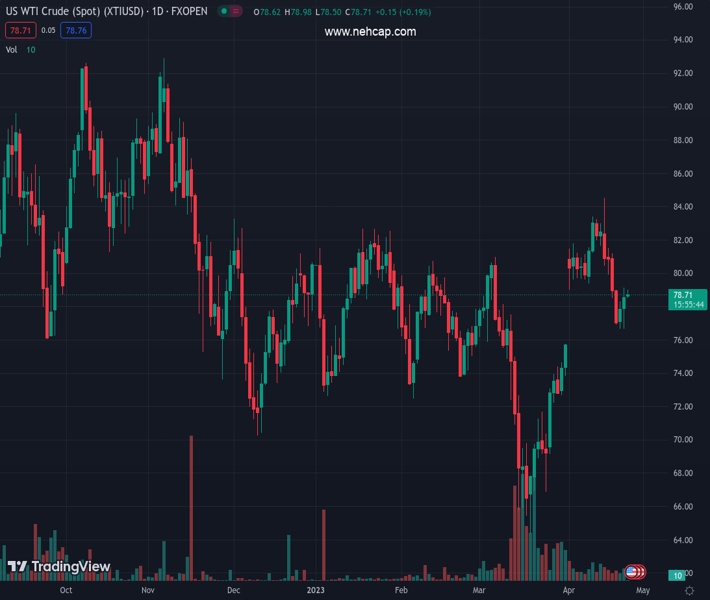
On the oil front, oil prices are attempting to overstep the immediate resistance of $79.00. The oil price rebounded on Monday as investors believe that a steady interest rate guidance from the Fed will recede recession fears.
Technical Levels: Supports and Resistances
XTIUSD currently trading at 28699.24 at the time of writing. Pair opened at 28699.24 and is trading with a change of 0.0 % .
| Overview | Overview.1 | |
|---|---|---|
| 0 | Today last price | 28699.24 |
| 1 | Today Daily Change | 0.00 |
| 2 | Today Daily Change % | 0.00 |
| 3 | Today daily open | 28699.24 |
The pair remains strongly bullish on the daily timeframe. It trades above its 20 SMA @ 28197.49, 50 SMA 27805.92, 100 SMA @ 27369.25 and 200 SMA @ 27525.59.
| Trends | Trends.1 | |
|---|---|---|
| 0 | Daily SMA20 | 28197.49 |
| 1 | Daily SMA50 | 27805.92 |
| 2 | Daily SMA100 | 27369.25 |
| 3 | Daily SMA200 | 27525.59 |
The previous day high was 28727.04 while the previous day low was 28540.42. The daily 38.2% Fib levels comes at 28655.75, expected to provide support. Similarly, the daily 61.8% fib level is at 28611.71, expected to provide support.
Note the levels of interest below:
- Pivot support is noted at 28584.09, 28468.95, 28397.47
- Pivot resistance is noted at 28770.71, 28842.19, 28957.33
| Levels | Levels.1 |
|---|---|
| Previous Daily High | 28727.04 |
| Previous Daily Low | 28540.42 |
| Previous Weekly High | 28744.85 |
| Previous Weekly Low | 28385.28 |
| Previous Monthly High | 28630.69 |
| Previous Monthly Low | 26446.43 |
| Daily Fibonacci 38.2% | 28655.75 |
| Daily Fibonacci 61.8% | 28611.71 |
| Daily Pivot Point S1 | 28584.09 |
| Daily Pivot Point S2 | 28468.95 |
| Daily Pivot Point S3 | 28397.47 |
| Daily Pivot Point R1 | 28770.71 |
| Daily Pivot Point R2 | 28842.19 |
| Daily Pivot Point R3 | 28957.33 |
[/s2If]
Nehcap Expert Advisor
The NEHCAP MT4 EA is high quality professional trading system geared to generate returns without using GRID or martingales. Each trade has strict risk per trade parameter. The pairs under management include EURUSD, GBPUSD, AUDCAD, AUDNZD,GBPAUD, EURAUD, EURCAD, CHFJPY and many more.
The system is trading live: LIVE ACCOUNT TRACKING
You can run it free. Apply for a free trial and track our account. Buy the system or use profit share mechanism to generate returns on your MT4.
Join Our Telegram Group
")


