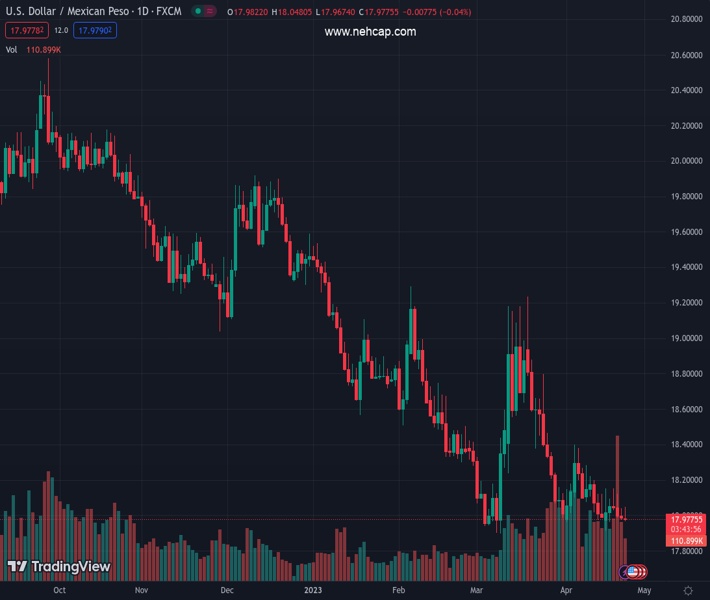
#USDMXN @ 17.9699 reached a daily high above 18.0000 before tumbling toward the 17.90s area. (Pivot Orderbook analysis)
…
This is a premium post.
[s2If !current_user_can(access_s2member_level4)]Please register for FREE REGISTER to read full post below containing analysis. In case of any error or you think you are not able to read the full post below, please email us at support#nehcap.com [lwa][/s2If] [s2If current_user_can(access_s2member_level1)]
- USD/MXN reached a daily high above 18.0000 before tumbling toward the 17.90s area.
- Fed’s Cook expects inflation to slow down as measured by headline inflation, but core PCE is foreseen to stay sticky.
- USD/MXN Price AnalysisL Downward pressured below 18.00; otherwise, expect upside towards the 20-day EMA.
The pair currently trades last at 17.9699.
The previous day high was 18.0432 while the previous day low was 17.9737. The daily 38.2% Fib levels comes at 18.0003, expected to provide resistance. Similarly, the daily 61.8% fib level is at 18.0167, expected to provide resistance.
The USD/MXN loses its appeal and drops below 18.0000, even though buyers eyed higher ceilings at around the 20-day EMA. A risk-off impulse keeps the emerging market currency fluctuating, although the US Dollar (USD) weakened. At the time of writing, the USD/MXN is exchanging hands at 17.9762.
After bottoming around the 17.9000 area in the last week, the USD/MXN pierced the 18.00 area before retracing and turning negative on Monday. That after the latest round of mixed US economic data and Mexican inflation slowing in the first half of April suggested that central bank divergence could weigh on the MXN.
Last Friday, the US Federal Reserve Governor, Lisa Cook, expressed that monetary policy is entering an uncertain phase and suggested that headwinds from the banking sector could impact the outlook for rising interest rates. She also anticipates a deceleration in March PCE inflation, though she added that core inflation remains sticky.
The agenda of US economic releases featured the March Chicago Fed National Activity Index (CFNAI), with figures plummeting to -0.19, above estimates of -20, unchanged from February’s reading. Despite the previously mentioned, the three-month moving average ticked up to 0.01%, signaling that the US economy continues to grow slower.
Of late, the Dallas Fed Manufacturing Business Index in April plummeted to -23.4, well below the -11.00 estimated, as the survey showed that perceptions of broader business conditions worsened, according to the poll.
On the Mexican front, annual headline inflation rose 6.24% through mid-April, its lowest level since October 2021. Core inflation stood at 7.75% for the same period. Even though the Bank of Mexico’s (Banxico) target is 3%, expectations that the central bank completed its tightening cycle have arisen.
Aside from this, investors’ odds that the Federal Reserve will hike rates by 25 bps are at 90%, according to the CME FedWatch Tool. However, traders estimate that the US central bank “could” cut rates by the September meeting, followed by another one in December.
The USD/MXN continues to track the 20-day EMA as its dynamic resistance for the latest couple of weeks. Although the USD/MXN printed a daily high at around 18.0480 shies of testing 18.0500, it retreated back below the 18.00 mark as it headed for testing the YTD lows at 17.8968. Downside risks emerged below 18.0000, with key support levels at 17.9142, before the abovementioned YTD low. Conversely, buyers reclaiming 18.0000 will pave the way for the USD/MXN to test the 20-day EMA at around 18.1200 before rallying to the 50-day EMA at 18.3310.
Technical Levels: Supports and Resistances
USDMXN currently trading at 17.9791 at the time of writing. Pair opened at 17.9885 and is trading with a change of -0.05 % .
| Overview | Overview.1 | |
|---|---|---|
| 0 | Today last price | 17.9791 |
| 1 | Today Daily Change | -0.0094 |
| 2 | Today Daily Change % | -0.0500 |
| 3 | Today daily open | 17.9885 |
The pair remains strongly bearish on the daily time frame. It trades below the 20 SMA @ 18.1122, 50 SMA 18.3152, 100 SMA @ 18.7622 and 200 SMA @ 19.3557.
| Trends | Trends.1 | |
|---|---|---|
| 0 | Daily SMA20 | 18.1122 |
| 1 | Daily SMA50 | 18.3152 |
| 2 | Daily SMA100 | 18.7622 |
| 3 | Daily SMA200 | 19.3557 |
The previous day high was 18.0432 while the previous day low was 17.9737. The daily 38.2% Fib levels comes at 18.0003, expected to provide resistance. Similarly, the daily 61.8% fib level is at 18.0167, expected to provide resistance.
Note the levels of interest below:
- Pivot support is noted at 17.9604, 17.9323, 17.8908
- Pivot resistance is noted at 18.0299, 18.0714, 18.0995
| Levels | Levels.1 |
|---|---|
| Previous Daily High | 18.0432 |
| Previous Daily Low | 17.9737 |
| Previous Weekly High | 18.1542 |
| Previous Weekly Low | 17.9329 |
| Previous Monthly High | 19.2324 |
| Previous Monthly Low | 17.8977 |
| Daily Fibonacci 38.2% | 18.0003 |
| Daily Fibonacci 61.8% | 18.0167 |
| Daily Pivot Point S1 | 17.9604 |
| Daily Pivot Point S2 | 17.9323 |
| Daily Pivot Point S3 | 17.8908 |
| Daily Pivot Point R1 | 18.0299 |
| Daily Pivot Point R2 | 18.0714 |
| Daily Pivot Point R3 | 18.0995 |
[/s2If]
Nehcap EA FIX downloadThe NEHCAP EA is high quality professional trading system geared to generate returns without using GRID or martingales.Each trade has strict risk per trade parameter. The pairs under management include EURUSD, GBPUSD, AUDCAD, AUDNZD,GBPAUD, EURAUD, EURCAD, CHFJPY and many more.The system is trading live: LIVE ACCOUNT TRACKING Apply for a free trial and track our account. Buy the system or use profit share mechanism to generate returns on your MT4.
Join Our Telegram Group
")


