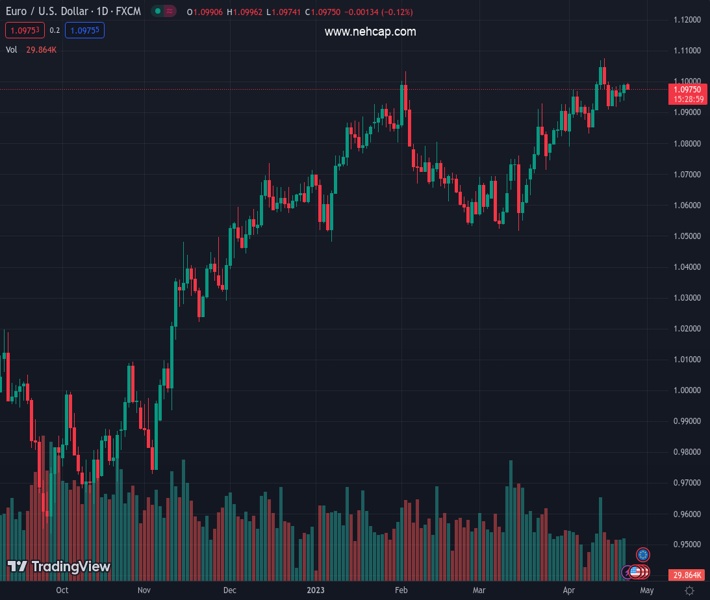
#EURUSD @ 1.09749 An absence of momentum in the upside move barricaded from kissing 1.1000. (Pivot Orderbook analysis)
…
This is a premium post.
[s2If !current_user_can(access_s2member_level4)]Please register for PREMIUM VERSION HERE to read full post below containing analysis. In case of any error or you think you are not able to read the full post below, please email us at support#nehcap.com [lwa][/s2If] [s2If current_user_can(access_s2member_level4)]
- An absence of momentum in the upside move barricaded EUR/USD from kissing 1.1000.
- ECB Wunsch expects a continuation of the policy-tightening spell if labor demand remains strong.
- The Euro faced pressure while attempting a breakout of the Ascending Triangle pattern.
The pair currently trades last at 1.09749.
The previous day high was 1.0994 while the previous day low was 1.0938. The daily 38.2% Fib levels comes at 1.0972, expected to provide support. Similarly, the daily 61.8% fib level is at 1.0959, expected to provide support.
The EUR/USD pair has dropped after failing to test the psychological resistance of 1.1000 in the early European session. The major currency pair has sensed selling pressure amid an absence of momentum in the upside move. Also, a recovery move in the US Dollar Index (DXY) has impacted on the shared currency pair.
The USD Index has refreshed its day’s high at 101.82 after a recovery move. On a broader note, the USD Index is consolidating in a wider range of 101.63-102.27 for the past four trading sessions.
On the Eurozone front, European Central Bank’s (ECB) Governing Council member Pierre Wunsch said that the central bank will continue raising interest rates until wage growth slows. He further added, “I would not be surprised if we had to go to 4 percent at some point.” The labor shortage has been a major trigger for stubborn Eurozone inflation and it will continue to propel households’ earnings.
EUR/USD is auctioning in an Ascending Triangle chart pattern on a two-hour scale. The Euro has faced pressure while attempting a breakout near the horizontal resistance of the aforementioned chart pattern plotted from April 17 high at 1.1000. The advancing trendline of the chart pattern is placed from April 19 low at 1.0917.
On a broader note, the upward-sloping trendline plotted from March 24 low at 1.0714 will continue to provide support to the Euro bulls. Overlapping movement in the asset and the 20-period Exponential Moving Average (EMA) around 1.0970 conveys a lackluster performance for now
Also, the Relative Strength Index (RSI) (14) is trading back and forth in a 40.00-60.00 range, conveying a consolidation ahead.
Going forward, a break above the psychological resistance of 1.1000 will drive the asset to a fresh annual high at 1.1068, followed by the round-level resistance at 1.1100.
On the flip side, a downside move below April 12 low at 1.0915 will drag the asset toward April 10 low at 1.0837 and April 03 low at 1.0788.
Technical Levels: Supports and Resistances
EURUSD currently trading at 1.098 at the time of writing. Pair opened at 1.0986 and is trading with a change of -0.05 % .
| Overview | Overview.1 | |
|---|---|---|
| 0 | Today last price | 1.0980 |
| 1 | Today Daily Change | -0.0006 |
| 2 | Today Daily Change % | -0.0500 |
| 3 | Today daily open | 1.0986 |
The pair remains strongly bullish on the daily timeframe. It trades above its 20 SMA @ 1.0921, 50 SMA 1.0767, 100 SMA @ 1.0736 and 200 SMA @ 1.0393.
| Trends | Trends.1 | |
|---|---|---|
| 0 | Daily SMA20 | 1.0921 |
| 1 | Daily SMA50 | 1.0767 |
| 2 | Daily SMA100 | 1.0736 |
| 3 | Daily SMA200 | 1.0393 |
The previous day high was 1.0994 while the previous day low was 1.0938. The daily 38.2% Fib levels comes at 1.0972, expected to provide support. Similarly, the daily 61.8% fib level is at 1.0959, expected to provide support.
Note the levels of interest below:
- Pivot support is noted at 1.0952, 1.0917, 1.0896
- Pivot resistance is noted at 1.1007, 1.1028, 1.1063
| Levels | Levels.1 |
|---|---|
| Previous Daily High | 1.0994 |
| Previous Daily Low | 1.0938 |
| Previous Weekly High | 1.1000 |
| Previous Weekly Low | 1.0909 |
| Previous Monthly High | 1.0930 |
| Previous Monthly Low | 1.0516 |
| Daily Fibonacci 38.2% | 1.0972 |
| Daily Fibonacci 61.8% | 1.0959 |
| Daily Pivot Point S1 | 1.0952 |
| Daily Pivot Point S2 | 1.0917 |
| Daily Pivot Point S3 | 1.0896 |
| Daily Pivot Point R1 | 1.1007 |
| Daily Pivot Point R2 | 1.1028 |
| Daily Pivot Point R3 | 1.1063 |
[/s2If]
Join Our Telegram Group
")


