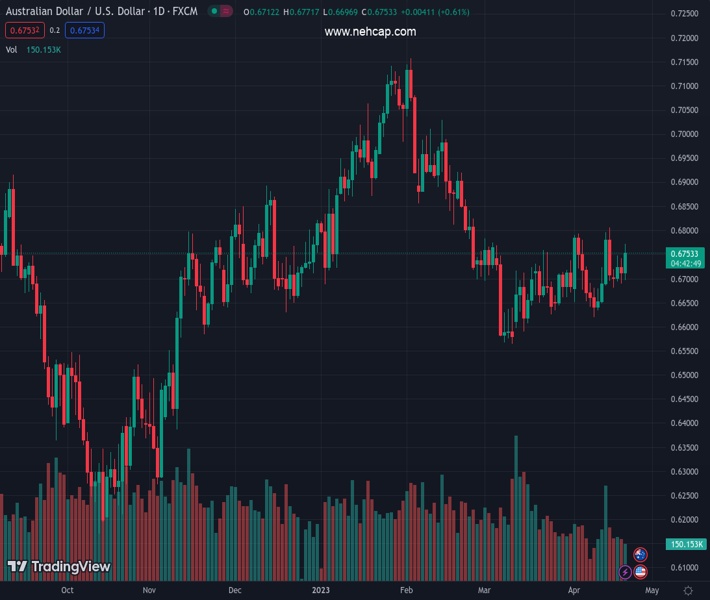
#AUDUSD @ 0.67544 Australian Dollar outperforms during the American session. (Pivot Orderbook analysis)
…
This is a premium post.
[s2If !current_user_can(access_s2member_level4)]Please register for PREMIUM VERSION HERE to read full post below containing analysis. In case of any error or you think you are not able to read the full post below, please email us at support#nehcap.com [lwa][/s2If] [s2If current_user_can(access_s2member_level4)]
- Australian Dollar outperforms during the American session.
- US Dollar loses momentum after US economic data.
- AUD/USD breaks short-term resistance, tests 0.6770.
The pair currently trades last at 0.67544.
The previous day high was 0.6741 while the previous day low was 0.669. The daily 38.2% Fib levels comes at 0.671, expected to provide support. Similarly, the daily 61.8% fib level is at 0.6722, expected to provide support.
The AUD/USD broke above 0.6740/45 and jumped to 0.6771, reaching the highest level in a week. The pair then pulled ack and is hovering around 0.6755, holding firm to daily gains.
The initial boost came from a weaker US Dollar, following the release of US economic data. Jobless Claims and the Philly Fed came in below expectations. US yields are falling. The 10-year yield falls almost 2% and is at 3.52%, a four-day low. The DXY is down by 0.17% after spending most of the day in positive ground.
The Australian Dollar is outperforming during the American session. The AUD/NZD is up by a hundred pips, above 1.0900, at the highest level since late February. EUR/AUD dropped to 1.6220, the lowest level in two weeks.
The AUD/USD is above the 0.6740 area, that has become the initial support. While above, the pair could keep testing the 0.6770 zone, the last defense for 0.6800. While above 0.6740, the bias is to the upside.
Technical Levels: Supports and Resistances
AUDUSD currently trading at 0.6753 at the time of writing. Pair opened at 0.6713 and is trading with a change of 0.6 % .
| Overview | Overview.1 | |
|---|---|---|
| 0 | Today last price | 0.6753 |
| 1 | Today Daily Change | 0.0040 |
| 2 | Today Daily Change % | 0.6000 |
| 3 | Today daily open | 0.6713 |
The pair is trading above its 20 Daily moving average @ 0.6699, above its 50 Daily moving average @ 0.6735 , below its 100 Daily moving average @ 0.68 and above its 200 Daily moving average @ 0.6744
| Trends | Trends.1 | |
|---|---|---|
| 0 | Daily SMA20 | 0.6699 |
| 1 | Daily SMA50 | 0.6735 |
| 2 | Daily SMA100 | 0.6800 |
| 3 | Daily SMA200 | 0.6744 |
The previous day high was 0.6741 while the previous day low was 0.669. The daily 38.2% Fib levels comes at 0.671, expected to provide support. Similarly, the daily 61.8% fib level is at 0.6722, expected to provide support.
Note the levels of interest below:
- Pivot support is noted at 0.6689, 0.6664, 0.6637
- Pivot resistance is noted at 0.674, 0.6766, 0.6791
| Levels | Levels.1 |
|---|---|
| Previous Daily High | 0.6741 |
| Previous Daily Low | 0.6690 |
| Previous Weekly High | 0.6806 |
| Previous Weekly Low | 0.6620 |
| Previous Monthly High | 0.6784 |
| Previous Monthly Low | 0.6564 |
| Daily Fibonacci 38.2% | 0.6710 |
| Daily Fibonacci 61.8% | 0.6722 |
| Daily Pivot Point S1 | 0.6689 |
| Daily Pivot Point S2 | 0.6664 |
| Daily Pivot Point S3 | 0.6637 |
| Daily Pivot Point R1 | 0.6740 |
| Daily Pivot Point R2 | 0.6766 |
| Daily Pivot Point R3 | 0.6791 |
[/s2If]
Join Our Telegram Group
")


