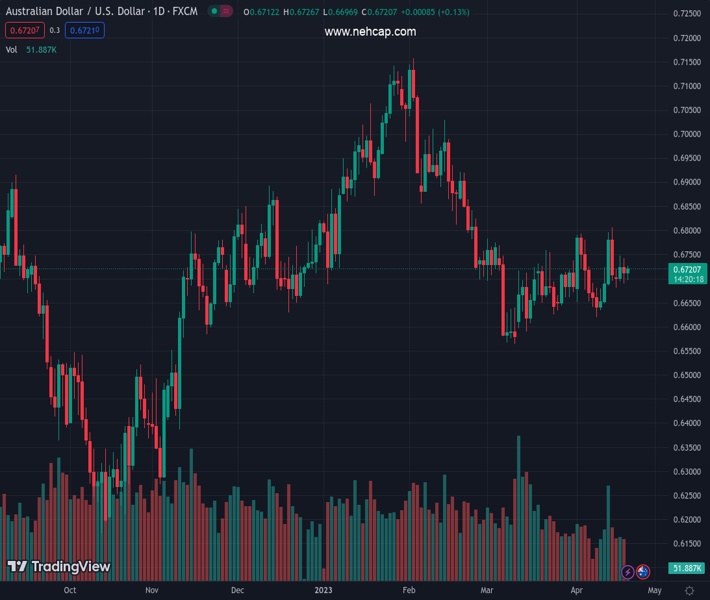
#AUDUSD @ 0.67187 is consolidating above 0.6700 after a mild corrective move. (Pivot Orderbook analysis)
…
This is a premium post.
[s2If !current_user_can(access_s2member_level4)]Please register for PREMIUM VERSION HERE to read full post below containing analysis. In case of any error or you think you are not able to read the full post below, please email us at support#nehcap.com [lwa][/s2If] [s2If current_user_can(access_s2member_level4)]
- AUD/USD is consolidating above 0.6700 after a mild corrective move.
- A synergic effect of further rate hikes from the Federal Reserve and tight credit conditions by US banks would weigh heavily on US inflation.
- An unchanged interest rate decision by the People’s Bank of China failed to impact the Australian Dollar.
- AUD/USD is auctioning in an Inverted Flag chart pattern which is a trend continuation pattern.
The pair currently trades last at 0.67187.
The previous day high was 0.6741 while the previous day low was 0.669. The daily 38.2% Fib levels comes at 0.671, expected to provide support. Similarly, the daily 61.8% fib level is at 0.6722, expected to provide resistance.
AUD/USD is displaying a sideways performance in a narrow range of the round-level resistance of 0.6700 in the early European session. The Aussie asset is consolidating after a mild correction move. The Australian Dollar didn’t show any major move as expected after the announcement of the interest rate decision by the People’s Bank of China (PBoC).
S&P500 futures are constantly adding losses in the Asian session as missed earnings from Netflix weighed on market sentiment. Meanwhile, Investors are worried that firms are coming with poor revenue guidance as interest rates by the Federal Reserve (Fed) have sky-rocketed and now United States banks are going extremely tight on loan disbursement to maintain asset quality. The events are cementing a slowdown in the US economy as firms would face a significant impact of the liquidity crisis.
The US Dollar Index (DXY) is showing a subdued performance as the upside is capped and the downside is restricted in a range of 101.93-102.04. Following the footprints of the subdued USD Index, the US Treasury yields are also displaying a lackluster performance. Yields on 10-year US Treasury bonds seem stable above 3.59%.
Investors were gauging reasons in Federal Reserve’s (Fed) Beige Book that would be supportive to force the Federal Reserve to consider an early pause to the policy-tightening spell. Except for tight credit conditions by US commercial banks, all economic indicators were favoring more rate hikes from the Federal Reserve.
Fed Beige Book released on April 19 was the first after the collapse of US regional banks and it showed how worried banks are about their asset quality. Lending volumes and loan demand generally declined across consumer and business loan types. Several districts noted that banks tightened lending standards amid increased uncertainty and concerns about liquidity.
Going forward, a synergic effect of further rate hikes from the Federal Reserve and tight standards for credit disbursement by US banks would weigh heavily on US inflationary pressures.
On the interest rate guidance, A Reuters poll on Fed’s interest rate guidance conveys that Fed chair Jerome Powell will deliver a final 25-basis-point interest rate increase in May and then hold rates steady for the rest of 2023. The survey also supports a short and shallow recession this year.
This week, preliminary US S&P PMI data will remain in the spotlight. The street is anticipating the Manufacturing PMI at 49.0, lower than the former release of 49.2. The Services PMI is also seen lower at 51.5 against the figure of 52.6 released earlier.
A power-pack action was expected from the Australian Dollar amid the announcement of the interest rate decision by the People’s Bank of China (PBoC). However, the Australian Dollar remained mute despite the People’s Bank of China holding its Loan Prime Rate (LPR) steady. China’s central bank has kept its one-year and five-year Loan Prime Rate (LPR) stable at 3.65% and 4.30% respectively. An unchanged monetary policy stance by the People’s Bank of China was already expected by the market participants.
Considering the fact that the Chinese economy is well on track for economic recovery after dismantling its pandemic controls, there was no urgency of easing monetary policy further. This week, the Gross Domestic Product (GDP) released for the first quarter remained critically upbeat. In the first quarter, China’s growth rate remained in line with estimates at 2.2%. On an annual basis, the growth rate jumped by 4.5% vs. consensus of 4.0% and the former release of 2.9%.
It is worth noting that Australia is a leading trading partner of China and higher growth prospects in China would be supportive of the Australian Dollar.
Going forward, Friday’s preliminary Australian S&P PMI data will be keenly watched. As per the consensus, Manufacturing PMI will drop to 48.8 from the former release of 49.1.
AUD/USD is auctioning in an Inverted Flag chart pattern which is a trend continuation pattern in which a long consolidation is followed by a breakdown. Usually, the consolidation phase of the chart pattern serves as an inventory adjustment in which those participants initiate shorts, which prefer to enter an auction after the establishment of a bearish bias and current sellers add more positions.
The 200-period Exponential Moving Average (EMA) at 0.6806 is acting as a barricade for the Australian Dollar bulls.
Meanwhile, the Relative Strength Index (RSI) (14) is hovering in the 40.00-60.00 range, signaling an absence of a potential trigger.
Technical Levels: Supports and Resistances
AUDUSD currently trading at 0.6707 at the time of writing. Pair opened at 0.6713 and is trading with a change of -0.09 % .
| Overview | Overview.1 | |
|---|---|---|
| 0 | Today last price | 0.6707 |
| 1 | Today Daily Change | -0.0006 |
| 2 | Today Daily Change % | -0.0900 |
| 3 | Today daily open | 0.6713 |
The pair is trading above its 20 Daily moving average @ 0.6699, below its 50 Daily moving average @ 0.6735 , below its 100 Daily moving average @ 0.68 and below its 200 Daily moving average @ 0.6744
| Trends | Trends.1 | |
|---|---|---|
| 0 | Daily SMA20 | 0.6699 |
| 1 | Daily SMA50 | 0.6735 |
| 2 | Daily SMA100 | 0.6800 |
| 3 | Daily SMA200 | 0.6744 |
The previous day high was 0.6741 while the previous day low was 0.669. The daily 38.2% Fib levels comes at 0.671, expected to provide support. Similarly, the daily 61.8% fib level is at 0.6722, expected to provide resistance.
Note the levels of interest below:
- Pivot support is noted at 0.6689, 0.6664, 0.6637
- Pivot resistance is noted at 0.674, 0.6766, 0.6791
| Levels | Levels.1 |
|---|---|
| Previous Daily High | 0.6741 |
| Previous Daily Low | 0.6690 |
| Previous Weekly High | 0.6806 |
| Previous Weekly Low | 0.6620 |
| Previous Monthly High | 0.6784 |
| Previous Monthly Low | 0.6564 |
| Daily Fibonacci 38.2% | 0.6710 |
| Daily Fibonacci 61.8% | 0.6722 |
| Daily Pivot Point S1 | 0.6689 |
| Daily Pivot Point S2 | 0.6664 |
| Daily Pivot Point S3 | 0.6637 |
| Daily Pivot Point R1 | 0.6740 |
| Daily Pivot Point R2 | 0.6766 |
| Daily Pivot Point R3 | 0.6791 |
[/s2If]
Join Our Telegram Group
")


