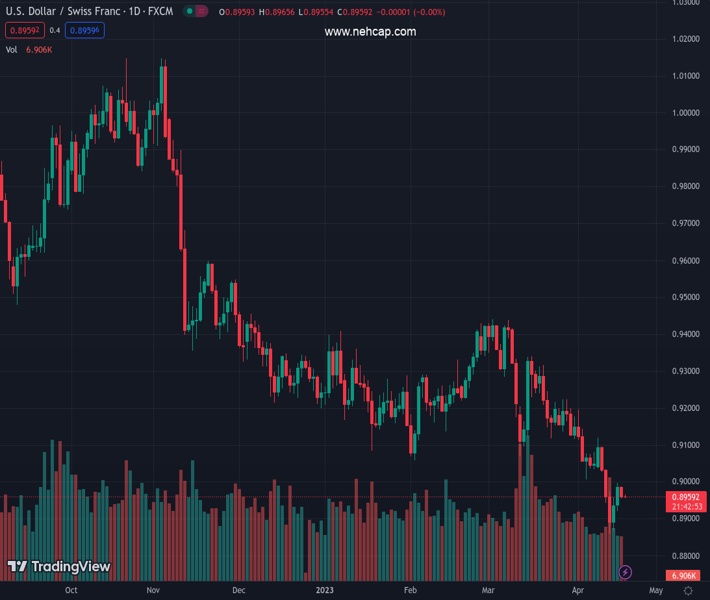
#USDCHF @ 0.89594 holds lower grounds after printing the first daily loss in three. (Pivot Orderbook analysis)
…
This is a premium post.
[s2If !current_user_can(access_s2member_level4)]Please register for PREMIUM VERSION HERE to read full post below containing analysis. In case of any error or you think you are not able to read the full post below, please email us at support#nehcap.com [lwa][/s2If] [s2If current_user_can(access_s2member_level4)]
- USD/CHF holds lower grounds after printing the first daily loss in three.
- US Dollar fails to justify hawkish Fed talks amid downbeat data, cautious optimism.
- Upbeat statistics elsewhere, cautious mood ahead of debt ceiling plan also weigh on USD.
- Light calendar can restrict Swiss Franc pair’s immediate moves.
The pair currently trades last at 0.89594.
The previous day high was 0.8996 while the previous day low was 0.8922. The daily 38.2% Fib levels comes at 0.8968, expected to provide resistance. Similarly, the daily 61.8% fib level is at 0.895, expected to provide support.
USD/CHF seeks fresh directions while keeping sellers hopeful around 0.8960, fading the bounce off the 27-month low marked the last week. That said, the Swiss Franc (CHF) pair snapped a two-day winning streak the previous day amid a broad US Dollar retreat.
US Dollar Index (DXY) reverses the latest rebound from a one-year low while printing the second daily loss in four. The greenback’s gauge versus six major currencies tracked downside yields to take a U-turn the previous day. That said, the US 10-year and two-year Treasury bond coupons dropped for the first time in four days by the end of Tuesday.
US Treasury bond yields and the US dollar bear the burden of downbeat US housing data while paying little heed to the hawkish Fed talks.
After witnessing upbeat prints of the NY Empire State Manufacturing Index and the US National Association of Home Builders (NAHB) housing market index on Monday, the US Housing Starts and Building Permits roiled the mood with downbeat prints for March on Tuesday. That said, the Housing Starts eased to 1.42M versus 1.432M prior and 1.40M market forecasts whereas the Building Permits dropped to 1.413M from 1.55M previous readings and analysts’ estimations of 2.2M.
On the other hand, St. Louis Federal Reserve President James Bullard said, in an interview with Reuters, “Interest rates will need to continue to rise in the absence of clear progress on inflation.” On Monday, Richmond Fed President Thomas Barkin said that he wants to see more evidence of inflation settling back to target.
Recently, Atlanta Fed President Raphael W. Bostic mentioned that the economy is still gaining momentum, but inflation is too high.
Contrary to the US data, firmer prints of China statistics and the UK jobs report, as well as mixed Eurozone economics, also weighed on the US Dollar and the USD/CHF prices. Amid these plays, the Wall Street closed mixed.
Moving on, a light calendar may allow the USD/CHF to continue with the latest pullback. However, risk catalysts surrounding the US debt ceiling plan and China can entertain intraday traders during the early hours.
A convergence of the 10-DMA and a two-week-old descending trend line, around 0.8995, quickly followed by the 0.9000 round figure, restricts the short-term upside of the USD/CHF pair.
Technical Levels: Supports and Resistances
USDCHF currently trading at 0.8961 at the time of writing. Pair opened at 0.8986 and is trading with a change of -0.28% % .
| Overview | Overview.1 | |
|---|---|---|
| 0 | Today last price | 0.8961 |
| 1 | Today Daily Change | -0.0025 |
| 2 | Today Daily Change % | -0.28% |
| 3 | Today daily open | 0.8986 |
The pair remains strongly bearish on the daily time frame. It trades below the 20 SMA @ 0.9092, 50 SMA 0.9211, 100 SMA @ 0.9247 and 200 SMA @ 0.9484.
| Trends | Trends.1 | |
|---|---|---|
| 0 | Daily SMA20 | 0.9092 |
| 1 | Daily SMA50 | 0.9211 |
| 2 | Daily SMA100 | 0.9247 |
| 3 | Daily SMA200 | 0.9484 |
The previous day high was 0.8996 while the previous day low was 0.8922. The daily 38.2% Fib levels comes at 0.8968, expected to provide resistance. Similarly, the daily 61.8% fib level is at 0.895, expected to provide support.
Note the levels of interest below:
- Pivot support is noted at 0.894, 0.8894, 0.8865
- Pivot resistance is noted at 0.9014, 0.9042, 0.9088
| Levels | Levels.1 |
|---|---|
| Previous Daily High | 0.8996 |
| Previous Daily Low | 0.8922 |
| Previous Weekly High | 0.9114 |
| Previous Weekly Low | 0.8860 |
| Previous Monthly High | 0.9440 |
| Previous Monthly Low | 0.9072 |
| Daily Fibonacci 38.2% | 0.8968 |
| Daily Fibonacci 61.8% | 0.8950 |
| Daily Pivot Point S1 | 0.8940 |
| Daily Pivot Point S2 | 0.8894 |
| Daily Pivot Point S3 | 0.8865 |
| Daily Pivot Point R1 | 0.9014 |
| Daily Pivot Point R2 | 0.9042 |
| Daily Pivot Point R3 | 0.9088 |
[/s2If]
Join Our Telegram Group
")


