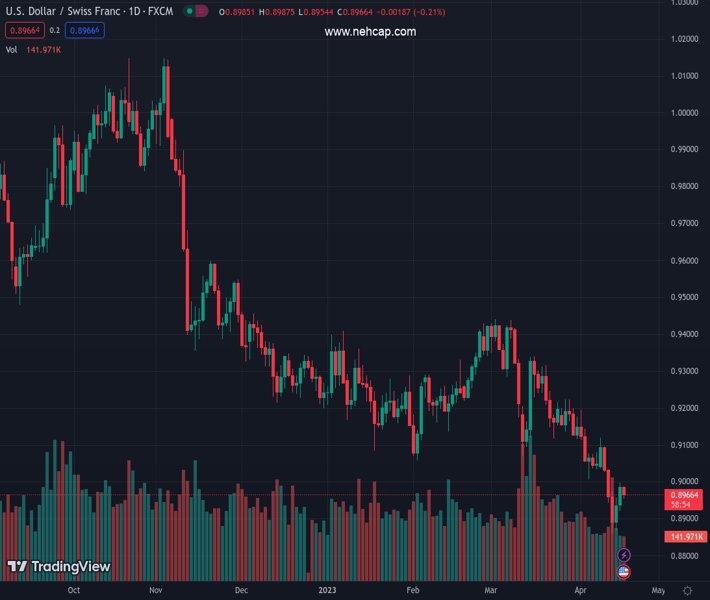
#USDCHF @ 0.89680 faces resistance at 0.9000 and falls for the first time in three days. (Pivot Orderbook analysis)
…
This is a premium post.
[s2If !current_user_can(access_s2member_level4)]Please register for PREMIUM VERSION HERE to read full post below containing analysis. In case of any error or you think you are not able to read the full post below, please email us at support#nehcap.com [lwa][/s2If] [s2If current_user_can(access_s2member_level4)]
- USD/CHF faces resistance at 0.9000 and falls for the first time in three days.
- USD/CHF Price Analysis: It might print a leg-up above 0.9000; otherwise, a bearish continuation would resume below 0.8900.
The pair currently trades last at 0.89680.
The previous day high was 0.8996 while the previous day low was 0.8922. The daily 38.2% Fib levels comes at 0.8968, expected to provide resistance. Similarly, the daily 61.8% fib level is at 0.895, expected to provide support.
USD/CHF retreats after posting back-to-back days of gains, down 0.17%, after hitting a weekly high of 0.8996. At the time of writing, the USD/CHF exchanges hands at 0.8969, ahead of the Wall Street close.
From a technical perspective, the USD/CHF daily chart portrays the major as downward biased, losing almost 3% annually. However, last Friday, the USD/CHF pair snapped three days of straight losses, forming a bullish piercing pattern that failed to extend above the psychological 0.9000 figure. Even though the USD/CHF is in a pullback, the Rate of Change (RoC) suggests that buyers are outpacing sellers, which could put into play a challenge of the 0.9000 figure.
If USD/CHF cracks the latter, that will expose the 20-day Exponential Moving Average (EMA) at 0.9065, followed by the 0.9100 mark. Once cleared, the USD/CHF could rally towards the 50-day EMA at 0.9164.
Conversely, a bearish continuation will resume once the USD/CHF breaks below 0.8921. A breach of the latter will expose the 0.8900 figure, followed by the YTD low at 0.8859.
Technical Levels: Supports and Resistances
USDCHF currently trading at 0.8972 at the time of writing. Pair opened at 0.8986 and is trading with a change of -0.16 % .
| Overview | Overview.1 | |
|---|---|---|
| 0 | Today last price | 0.8972 |
| 1 | Today Daily Change | -0.0014 |
| 2 | Today Daily Change % | -0.1600 |
| 3 | Today daily open | 0.8986 |
The pair remains strongly bearish on the daily time frame. It trades below the 20 SMA @ 0.9092, 50 SMA 0.9211, 100 SMA @ 0.9247 and 200 SMA @ 0.9484.
| Trends | Trends.1 | |
|---|---|---|
| 0 | Daily SMA20 | 0.9092 |
| 1 | Daily SMA50 | 0.9211 |
| 2 | Daily SMA100 | 0.9247 |
| 3 | Daily SMA200 | 0.9484 |
The previous day high was 0.8996 while the previous day low was 0.8922. The daily 38.2% Fib levels comes at 0.8968, expected to provide resistance. Similarly, the daily 61.8% fib level is at 0.895, expected to provide support.
Note the levels of interest below:
- Pivot support is noted at 0.894, 0.8894, 0.8865
- Pivot resistance is noted at 0.9014, 0.9042, 0.9088
| Levels | Levels.1 |
|---|---|
| Previous Daily High | 0.8996 |
| Previous Daily Low | 0.8922 |
| Previous Weekly High | 0.9114 |
| Previous Weekly Low | 0.8860 |
| Previous Monthly High | 0.9440 |
| Previous Monthly Low | 0.9072 |
| Daily Fibonacci 38.2% | 0.8968 |
| Daily Fibonacci 61.8% | 0.8950 |
| Daily Pivot Point S1 | 0.8940 |
| Daily Pivot Point S2 | 0.8894 |
| Daily Pivot Point S3 | 0.8865 |
| Daily Pivot Point R1 | 0.9014 |
| Daily Pivot Point R2 | 0.9042 |
| Daily Pivot Point R3 | 0.9088 |
[/s2If]
Join Our Telegram Group
")


