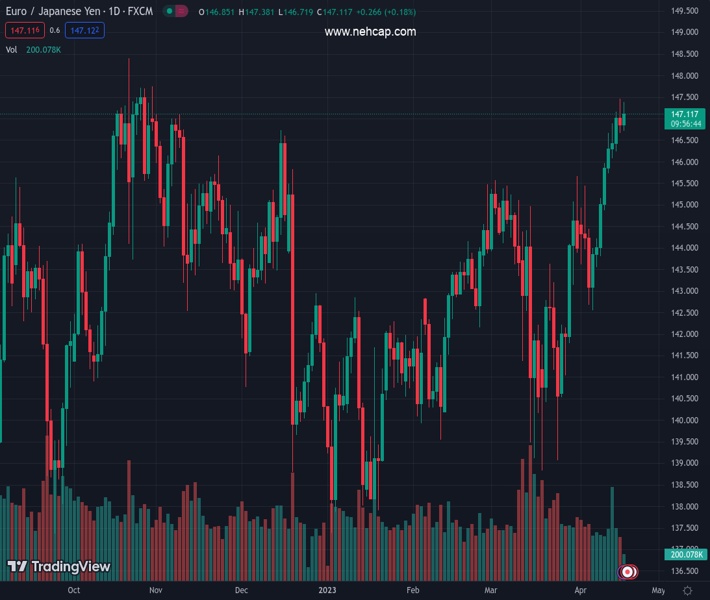
#EURJPY @ 147.136 resumes the upside above the 147.00 mark (Pivot Orderbook analysis)
…
This is a premium post.
[s2If !current_user_can(access_s2member_level4)]Please register for PREMIUM VERSION HERE to read full post below containing analysis. In case of any error or you think you are not able to read the full post below, please email us at support#nehcap.com [lwa][/s2If] [s2If current_user_can(access_s2member_level4)]
- EUR/JPY resumes the upside above the 147.00 mark
- Next on the upside comes the 2022 high past 148.00.
The pair currently trades last at 147.136.
The previous day high was 147.45 while the previous day low was 146.67. The daily 38.2% Fib levels comes at 146.97, expected to provide support. Similarly, the daily 61.8% fib level is at 147.15, expected to provide resistance.
EUR/JPY leaves behind Monday’s drop and regains upside traction above the ey 147.00 hurdle on Tuesday.
Considering the ongoing price action, further gains in the cross remain in store for the time being. That said, the continuation of the upside momentum could extend further and challenge the 2022 peak at 148.40 (October 21) sooner rather than later.
So far, further upside looks favoured while the cross trades above the 200-day SMA, today at 142.11.
Technical Levels: Supports and Resistances
EURJPY currently trading at 147.1 at the time of writing. Pair opened at 146.93 and is trading with a change of 0.12 % .
| Overview | Overview.1 | |
|---|---|---|
| 0 | Today last price | 147.10 |
| 1 | Today Daily Change | 67.00 |
| 2 | Today Daily Change % | 0.12 |
| 3 | Today daily open | 146.93 |
The pair remains strongly bullish on the daily timeframe. It trades above its 20 SMA @ 144.08, 50 SMA 143.45, 100 SMA @ 142.59 and 200 SMA @ 142.1.
| Trends | Trends.1 | |
|---|---|---|
| 0 | Daily SMA20 | 144.08 |
| 1 | Daily SMA50 | 143.45 |
| 2 | Daily SMA100 | 142.59 |
| 3 | Daily SMA200 | 142.10 |
The previous day high was 147.45 while the previous day low was 146.67. The daily 38.2% Fib levels comes at 146.97, expected to provide support. Similarly, the daily 61.8% fib level is at 147.15, expected to provide resistance.
Note the levels of interest below:
- Pivot support is noted at 146.58, 146.23, 145.8
- Pivot resistance is noted at 147.36, 147.8, 148.14
| Levels | Levels.1 |
|---|---|
| Previous Daily High | 147.45 |
| Previous Daily Low | 146.67 |
| Previous Weekly High | 147.16 |
| Previous Weekly Low | 143.80 |
| Previous Monthly High | 145.67 |
| Previous Monthly Low | 138.83 |
| Daily Fibonacci 38.2% | 146.97 |
| Daily Fibonacci 61.8% | 147.15 |
| Daily Pivot Point S1 | 146.58 |
| Daily Pivot Point S2 | 146.23 |
| Daily Pivot Point S3 | 145.80 |
| Daily Pivot Point R1 | 147.36 |
| Daily Pivot Point R2 | 147.80 |
| Daily Pivot Point R3 | 148.14 |
[/s2If]
Join Our Telegram Group
")


