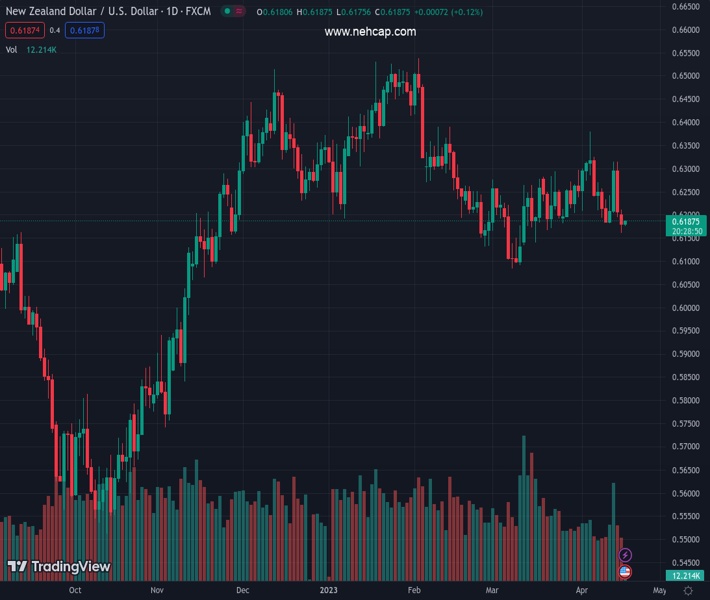
#NZDUSD @ 0.61858 is aiming to shore up its recovery above 0.6186 amid a minor correction in the USD Index. (Pivot Orderbook analysis)
…
This is a premium post.
[s2If !current_user_can(access_s2member_level4)]Please register for PREMIUM VERSION HERE to read full post below containing analysis. In case of any error or you think you are not able to read the full post below, please email us at support#nehcap.com [lwa][/s2If] [s2If current_user_can(access_s2member_level4)]
- NZD/USD is aiming to shore up its recovery above 0.6186 amid a minor correction in the USD Index.
- As per the consensus, the Chinese economy has expanded by 2.2% after a stagnant performance.
- NZ inflation is becoming stubborn further despite higher rates by the RBNZ.
The pair currently trades last at 0.61858.
The previous day high was 0.6213 while the previous day low was 0.6161. The daily 38.2% Fib levels comes at 0.6181, expected to provide support. Similarly, the daily 61.8% fib level is at 0.6193, expected to provide resistance.
The NZD/USD pair is gathering strength for extending its recovery above 0.6186 in the Asian session. The Kiwi asset recovered firmly after dropping to near 0.6160 as the US Dollar Index (DXY) went through a gradual correction. The New Zealand Dollar is expected to remain on the tenterhooks as investors are awaiting the release of China’s Gross Domestic Product (GDP) (Q1) data.
S&P500 futures are showing a subdued performance in the Tokyo session as investors are worried about corporate profits to be reported ahead. Tech-giant Google was dumped by investors amid reports that South Korea’s Samsung Electronics was considering replacing Google with Microsoft-owned Bing as the default search engine on its devices.
The US Dollar Index (DXY) is displaying a rangebound performance around 102.10 after a nominal correction. The USD Index is expected to resume its upside journey as investors are anticipating a continuation of the policy-tightening spell by the Federal Reserve (Fed).
As per the consensus, the Chinese economy has expanded by 2.2% vs. a stagnant performance. On an annual basis, the economy is expanded by 4.0% against the 2.9% growth rate recorded earlier. It is worth noting that New Zealand is one of the leading trading partners of China and higher Chinese GDP data would support the New Zealand Dollar.
Later this week, New Zealand’s quarterly inflation data will be keenly watched. According to the consensus, NZ inflationary pressures have accelerated by 2.0% in the quarter, higher than the former pace of 1.4%. Annual NZ inflation data has scaled to 7.5% from the former release of 7.2%. Households in the NZ economy are expected to go through a lot of pain as NZ inflation is becoming stubborn further despite higher rates by the Reserve Bank of New Zealand (RBNZ).
Technical Levels: Supports and Resistances
NZDUSD currently trading at 0.6184 at the time of writing. Pair opened at 0.6182 and is trading with a change of 0.03 % .
| Overview | Overview.1 | |
|---|---|---|
| 0 | Today last price | 0.6184 |
| 1 | Today Daily Change | 0.0002 |
| 2 | Today Daily Change % | 0.0300 |
| 3 | Today daily open | 0.6182 |
The pair is trading below its 20 Daily moving average @ 0.6241, below its 50 Daily moving average @ 0.6234 , below its 100 Daily moving average @ 0.6304 and above its 200 Daily moving average @ 0.6162
| Trends | Trends.1 | |
|---|---|---|
| 0 | Daily SMA20 | 0.6241 |
| 1 | Daily SMA50 | 0.6234 |
| 2 | Daily SMA100 | 0.6304 |
| 3 | Daily SMA200 | 0.6162 |
The previous day high was 0.6213 while the previous day low was 0.6161. The daily 38.2% Fib levels comes at 0.6181, expected to provide support. Similarly, the daily 61.8% fib level is at 0.6193, expected to provide resistance.
Note the levels of interest below:
- Pivot support is noted at 0.6158, 0.6133, 0.6106
- Pivot resistance is noted at 0.621, 0.6237, 0.6262
| Levels | Levels.1 |
|---|---|
| Previous Daily High | 0.6213 |
| Previous Daily Low | 0.6161 |
| Previous Weekly High | 0.6316 |
| Previous Weekly Low | 0.6169 |
| Previous Monthly High | 0.6298 |
| Previous Monthly Low | 0.6084 |
| Daily Fibonacci 38.2% | 0.6181 |
| Daily Fibonacci 61.8% | 0.6193 |
| Daily Pivot Point S1 | 0.6158 |
| Daily Pivot Point S2 | 0.6133 |
| Daily Pivot Point S3 | 0.6106 |
| Daily Pivot Point R1 | 0.6210 |
| Daily Pivot Point R2 | 0.6237 |
| Daily Pivot Point R3 | 0.6262 |
[/s2If]
Join Our Telegram Group
")


