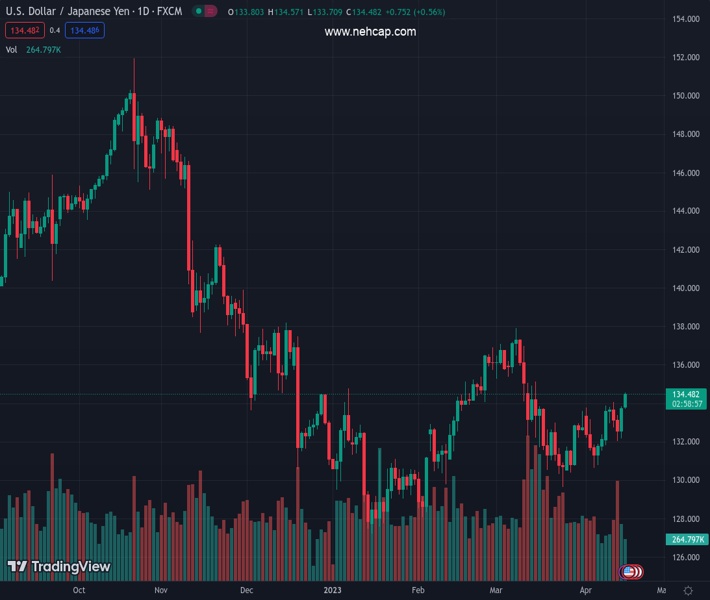
#USDJPY @ 134.480 reached fresh five-week highs at 134.57, with bulls eyeing 135.00. (Pivot Orderbook analysis)
…
This is a premium post.
[s2If !current_user_can(access_s2member_level4)]Please register for PREMIUM VERSION HERE to read full post below containing analysis. In case of any error or you think you are not able to read the full post below, please email us at support#nehcap.com [lwa][/s2If] [s2If current_user_can(access_s2member_level4)]
- USD/JPY reached fresh five-week highs at 134.57, with bulls eyeing 135.00.
- Oscillators at bullish areas favor further upside in the USD/JPY.
- Downside risks lie below 134.00, which could drive the USD/JPY towards 133.00.
The pair currently trades last at 134.480.
The previous day high was 133.84 while the previous day low was 132.17. The daily 38.2% Fib levels comes at 133.2, expected to provide support. Similarly, the daily 61.8% fib level is at 132.81, expected to provide support.
The USD/JPY moved higher as US Treasury bond yields resumed their uptrend, following the last week’s hawkish commentary by Federal Reserve (Fed) officials. Fed Board Governor Christopher Waller’s comments that more tightening is needed, triggered the latest jump in the 10-year US T-bond yield. Therefore, the USD/JPY rallied and is trading at 134.47, up 0.52%.
The USD/JPY extended its gains past the last week’s high of 134.04, and it’s aiming to challenge a break above January 6 high at 134.77. On its way up, the USD/JPY climbed above several solid resistance areas, like the 200-day Exponential Moving Average (EMA) EMA at 133.70, followed by the 100-day Exponential Moving Average (EMA) at 134.00. Once the pair cleared those levels, a challenge to 135.00 is on the cards.
The Relative Strength Index (RSI) cements the upward case in bullish territory, while the Rate of Change (RoC) indicates that buying pressure is increasing.
If USD/JPY rallies above 135.00, the next resistance would be 136.00, followed by the psychological 137.00 level before testing the YTD high at 137.91. Conversely, if the USD/JPY retraces, the first support would be 100-day EMA at 134.00. A breach of the latter will immediately expose the 200-day EMA at 133.70, followed by the 50-day EMA At 133.14, before sliding to 133.00.
Technical Levels: Supports and Resistances
USDJPY currently trading at 134.46 at the time of writing. Pair opened at 133.77 and is trading with a change of 0.52 % .
| Overview | Overview.1 | |
|---|---|---|
| 0 | Today last price | 134.46 |
| 1 | Today Daily Change | 0.69 |
| 2 | Today Daily Change % | 0.52 |
| 3 | Today daily open | 133.77 |
The pair is trading above its 20 Daily moving average @ 132.19, above its 50 Daily moving average @ 133.47 , above its 100 Daily moving average @ 133.14 and below its 200 Daily moving average @ 137.16
| Trends | Trends.1 | |
|---|---|---|
| 0 | Daily SMA20 | 132.19 |
| 1 | Daily SMA50 | 133.47 |
| 2 | Daily SMA100 | 133.14 |
| 3 | Daily SMA200 | 137.16 |
The previous day high was 133.84 while the previous day low was 132.17. The daily 38.2% Fib levels comes at 133.2, expected to provide support. Similarly, the daily 61.8% fib level is at 132.81, expected to provide support.
Note the levels of interest below:
- Pivot support is noted at 132.68, 131.59, 131.01
- Pivot resistance is noted at 134.35, 134.93, 136.02
| Levels | Levels.1 |
|---|---|
| Previous Daily High | 133.84 |
| Previous Daily Low | 132.17 |
| Previous Weekly High | 134.04 |
| Previous Weekly Low | 131.83 |
| Previous Monthly High | 137.91 |
| Previous Monthly Low | 129.64 |
| Daily Fibonacci 38.2% | 133.20 |
| Daily Fibonacci 61.8% | 132.81 |
| Daily Pivot Point S1 | 132.68 |
| Daily Pivot Point S2 | 131.59 |
| Daily Pivot Point S3 | 131.01 |
| Daily Pivot Point R1 | 134.35 |
| Daily Pivot Point R2 | 134.93 |
| Daily Pivot Point R3 | 136.02 |
[/s2If]
Join Our Telegram Group
")


