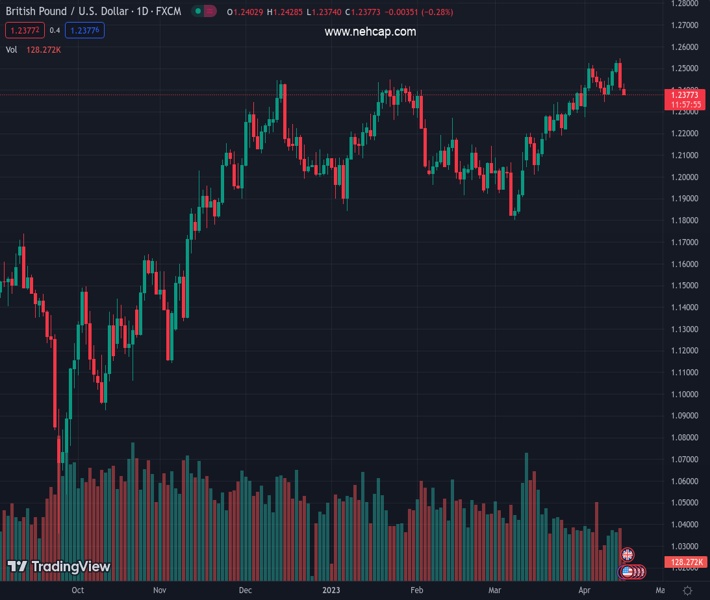
#GBPUSD @ 1.23746 struggles to gain any meaningful traction on Monday and oscillates in a range. (Pivot Orderbook analysis)
…
This is a premium post.
[s2If !current_user_can(access_s2member_level4)]Please register for PREMIUM VERSION HERE to read full post below containing analysis. In case of any error or you think you are not able to read the full post below, please email us at support#nehcap.com [lwa][/s2If] [s2If current_user_can(access_s2member_level4)]
- GBP/USD struggles to gain any meaningful traction on Monday and oscillates in a range.
- Bets for another 25 Fed rate hike in May underpin the USD and cap gains for the major.
- The prospects for an imminent Fed rate-hike pause keep a lid on any further USD gains.
The pair currently trades last at 1.23746.
The previous day high was 1.2546 while the previous day low was 1.2399. The daily 38.2% Fib levels comes at 1.2455, expected to provide resistance. Similarly, the daily 61.8% fib level is at 1.249, expected to provide resistance.
The GBP/USD pair kicks off the new week on a subdued note and seesaws between tepid gains/minor losses through the early part of the European session. The pair is currently placed around the 1.2400 mark, nearly unchanged for the day, and for now, seems to have stalled its retracement slide from the highest level since June 2022 touched on Friday.
The US Dollar (USD) edges higher for the second successive day and looks to build on the previous day’s recovery move from a one-year low, which, in turn, is seen acting as a headwind for the GBP/USD pair. The University of Michigan’s preliminary report showed that one-year inflation expectations rose to 4.6% from 3.6% in March and fueled speculations that the Federal Reserve (Fed) might continue raising interest rates. In fact, the markets are pricing in a greater chance of another 25 bps lift-off at the next FOMC meeting in May. This remains supportive of elevated US Treasury bond yields and continues to underpin the Greenback.
Investors, however, seem convinced that the US central bank will pause its rate-hiking cycle, sooner rather than later, amid signs of easing inflationary pressures. The expectations were boosted by the US CPI and the PPI report released last week, which indicated that disinflation is progressing smoothly. Moreover, the mostly downbeat US Retail Sales figures on Friday reaffirmed the view that the Fed’s year-long interest rate hiking campaign is cooling domestic demand. This, in turn, is holding back the USD bulls from placing aggressive bets and acting as a tailwind for the GBP/USD pair, warranting some caution for aggressive bearish traders.
In the absence of any relevant market-moving macro data from the UK, trades now look to the US economic docket, featuring the release of the Empire State Manufacturing Index later during the early North American session. Apart from this, the US bond yields, along with the broader risk sentiment, will drive the USD demand and produce short-term trading opportunities around the GBP/USD pair. The focus will then shift to the monthly UK employment details on Tuesday, which should provide some meaningful impetus.
Technical Levels: Supports and Resistances
GBPUSD currently trading at 1.2392 at the time of writing. Pair opened at 1.2412 and is trading with a change of -0.16 % .
| Overview | Overview.1 | |
|---|---|---|
| 0 | Today last price | 1.2392 |
| 1 | Today Daily Change | -0.0020 |
| 2 | Today Daily Change % | -0.1600 |
| 3 | Today daily open | 1.2412 |
The pair remains strongly bullish on the daily timeframe. It trades above its 20 SMA @ 1.237, 50 SMA 1.2173, 100 SMA @ 1.2182 and 200 SMA @ 1.1913.
| Trends | Trends.1 | |
|---|---|---|
| 0 | Daily SMA20 | 1.2370 |
| 1 | Daily SMA50 | 1.2173 |
| 2 | Daily SMA100 | 1.2182 |
| 3 | Daily SMA200 | 1.1913 |
The previous day high was 1.2546 while the previous day low was 1.2399. The daily 38.2% Fib levels comes at 1.2455, expected to provide resistance. Similarly, the daily 61.8% fib level is at 1.249, expected to provide resistance.
Note the levels of interest below:
- Pivot support is noted at 1.2359, 1.2306, 1.2212
- Pivot resistance is noted at 1.2506, 1.26, 1.2653
| Levels | Levels.1 |
|---|---|
| Previous Daily High | 1.2546 |
| Previous Daily Low | 1.2399 |
| Previous Weekly High | 1.2546 |
| Previous Weekly Low | 1.2344 |
| Previous Monthly High | 1.2424 |
| Previous Monthly Low | 1.1803 |
| Daily Fibonacci 38.2% | 1.2455 |
| Daily Fibonacci 61.8% | 1.2490 |
| Daily Pivot Point S1 | 1.2359 |
| Daily Pivot Point S2 | 1.2306 |
| Daily Pivot Point S3 | 1.2212 |
| Daily Pivot Point R1 | 1.2506 |
| Daily Pivot Point R2 | 1.2600 |
| Daily Pivot Point R3 | 1.2653 |
[/s2If]
Join Our Telegram Group
")


