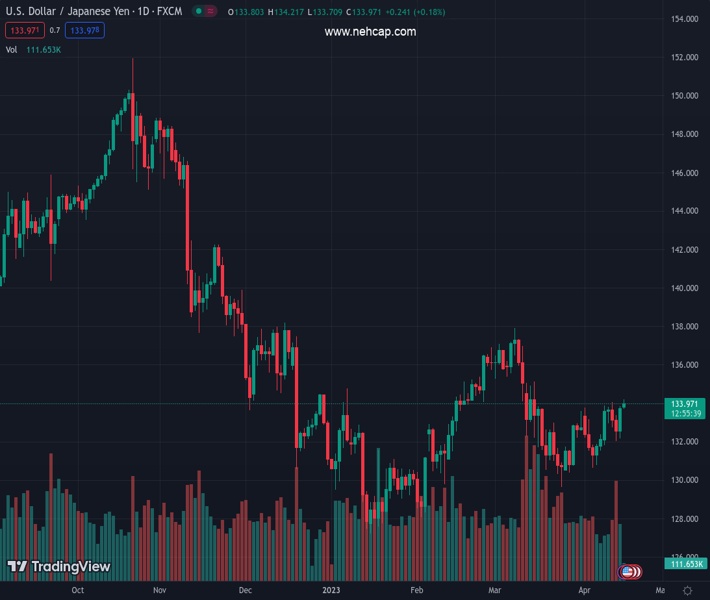
#USDJPY @ 134.039 edges higher for the second successive day, albeit lacks any follow-through buying. (Pivot Orderbook analysis)
…
This is a premium post.
[s2If !current_user_can(access_s2member_level4)]Please register for PREMIUM VERSION HERE to read full post below containing analysis. In case of any error or you think you are not able to read the full post below, please email us at support#nehcap.com [lwa][/s2If] [s2If current_user_can(access_s2member_level4)]
- USD/JPY edges higher for the second successive day, albeit lacks any follow-through buying.
- Expectations for an imminent Fed rate-hike pause act as a headwind for the USD and the pair.
- A combination of factors weighs on the JPY and continues to lend some support to the major.
The pair currently trades last at 134.039.
The previous day high was 133.84 while the previous day low was 132.17. The daily 38.2% Fib levels comes at 133.2, expected to provide support. Similarly, the daily 61.8% fib level is at 132.81, expected to provide support.
The USD/JPY pair trims a part of its modest intraday gains to over a one-month high touched earlier this Monday and retreats below the 134.00 mark during the early European session.
Expectations that the Federal Reserve (Fed) will pause its rate-hiking cycle, sooner rather than later, fail to assist the US Dollar (USD) to capitalize on its recovery move from a one-year low, which, in turn, acts as a headwind for the USD/JPY pair. The bets were lifted after the US CPI and the PPI report released last week indicated that disinflation is progressing smoothly. That said, speculations that the US central bank might continue raising rates in the wake of a rise in short-term inflation expectations should help limit any meaningful downfall for the Greenback and the major, at least for now.
In fact, the University of Michigan’s preliminary report showed that one-year inflation expectations rose to 4.6% from 3.6% in March and Consumer Sentiment Index inched up from 62.0 to 63.5 in April. Adding to this, impressive bank earnings eased concerns about a banking crisis that unfolded in March. Apart from this, resilience in US core retail sales suggested that the US economy is not so bad. This reaffirms expectations for another 25 bps lift-off at the next FOMC policy meeting in May, which remains supportive of elevated US Treasury bond yields and lends some support to the USD.
The two-year US Government bond, which typically moves in step with interest rate expectations, and the benchmark 10-year Treasury note, hold steady near a two-week top. The resultant widening of the US-Japan rate differential, along with the Bank of Japan’s (BoJ) dovish near-term outlook, might continue to undermine the Japanese Yen (JPY) and further contribute to limiting the downside for the USD/JPY pair. Even from a technical perspective, a sustained strength beyond the 50-day and the 100-day Simple Moving Averages (SMAs) supports prospects for some near-term appreciating move.
Market participants now look forward to the US economic docket, featuring the release of the Empire State Manufacturing Index later during the early North American session. This, along with the US bond yields, should influence the USD price dynamics and provide some impetus to the USD/JPY pair. Traders will further take cues from the broader risk sentiment, which tends to drive demand for the safe-haven JPY, to grab short-term opportunities.
Technical Levels: Supports and Resistances
USDJPY currently trading at 133.93 at the time of writing. Pair opened at 133.77 and is trading with a change of 0.12 % .
| Overview | Overview.1 | |
|---|---|---|
| 0 | Today last price | 133.93 |
| 1 | Today Daily Change | 0.16 |
| 2 | Today Daily Change % | 0.12 |
| 3 | Today daily open | 133.77 |
The pair is trading above its 20 Daily moving average @ 132.19, above its 50 Daily moving average @ 133.47 , above its 100 Daily moving average @ 133.14 and below its 200 Daily moving average @ 137.16
| Trends | Trends.1 | |
|---|---|---|
| 0 | Daily SMA20 | 132.19 |
| 1 | Daily SMA50 | 133.47 |
| 2 | Daily SMA100 | 133.14 |
| 3 | Daily SMA200 | 137.16 |
The previous day high was 133.84 while the previous day low was 132.17. The daily 38.2% Fib levels comes at 133.2, expected to provide support. Similarly, the daily 61.8% fib level is at 132.81, expected to provide support.
Note the levels of interest below:
- Pivot support is noted at 132.68, 131.59, 131.01
- Pivot resistance is noted at 134.35, 134.93, 136.02
| Levels | Levels.1 |
|---|---|
| Previous Daily High | 133.84 |
| Previous Daily Low | 132.17 |
| Previous Weekly High | 134.04 |
| Previous Weekly Low | 131.83 |
| Previous Monthly High | 137.91 |
| Previous Monthly Low | 129.64 |
| Daily Fibonacci 38.2% | 133.20 |
| Daily Fibonacci 61.8% | 132.81 |
| Daily Pivot Point S1 | 132.68 |
| Daily Pivot Point S2 | 131.59 |
| Daily Pivot Point S3 | 131.01 |
| Daily Pivot Point R1 | 134.35 |
| Daily Pivot Point R2 | 134.93 |
| Daily Pivot Point R3 | 136.02 |
[/s2If]
Join Our Telegram Group
")


